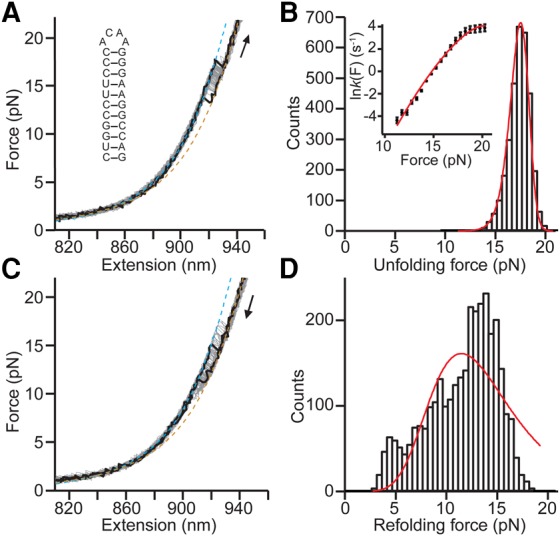
FIGURE 2.

Force spectroscopy of the HIV-1 upper stem alone. (A) Individual unfolding FECs (black) are plotted above the aggregated data from 100 FECs (gray). WLC fits are shown for the folded (cyan) and unfolded (orange) branches of the FECs. (Inset) Secondary structure of the HIV-1 upper stem alone. (B) The distribution of unfolding forces for HIV-1 upper stem alone FECs (black) is fit well by Equation 2 (red), yielding parameters describing the mechanical resistance to unfolding. (Inset) Force-dependent unfolding rate (black) is fit well by Equation 3 (red). (C) Individual refolding FECs (black) are plotted along with the aggregated data from 100 FECs (gray). WLC fits are shown for the unfolded (orange) and folded (cyan) branches of the FECs. (D) The distribution of refolding forces for HIV-1 upper stem alone FECs (black) is poorly fit by Equation 2 (red), a consequence of heterogeneous refolding that is more complicated than the single-barrier two-state behavior observed for unfolding.
