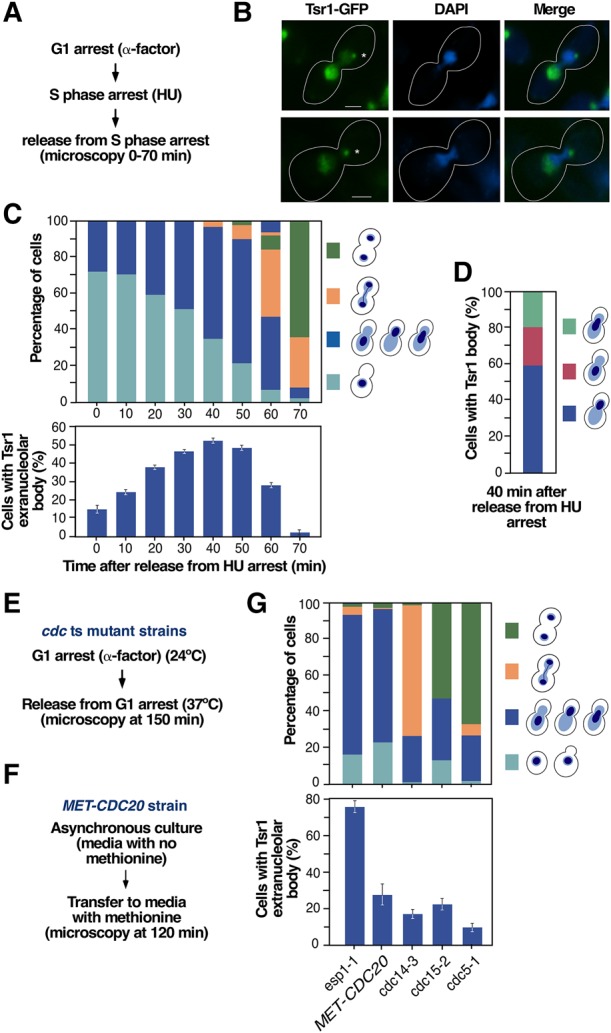
FIGURE 1.

Tsr1-GFP localizes at an extranucleolar body in early mitosis. (A) Outline of the experimental plan to analyze the subcellular distribution of GFP-tagged Tsr1 in early mitosis. HU, hydroxyurea. (B) Representative images of Tsr1-GFP (green color) in cells transiting early mitosis. As in the rest of the figures, the time taken for imaging cells was 40 min upon the release of cells from hydroxyurea arrest. Scale bars, 2 µm. Asterisks indicate the position of the Tsr1+ extranucleolar body. (C) Quantification of cells at different cell-cycle stages using as criteria the position of the DNA mass (top panel) and of cells with Tsr1-GFP at the extranucleolar body upon release from hydroxyurea arrest (bottom panel). The types of cell morphology and position of the DNA mass are depicted on the right. (D) Quantification of differences in the positioning of the DNA mass in cells that exhibit the Tsr1+ extranucleolar body. The positioning types of the DNA mass are depicted on the right. (E,F) Outlines of the experimental plans used to analyze the presence of the Tsr1+ extranucleolar body in cells blocked at different stages of mitosis. ts, temperature-sensitive. (G) Quantification of cell-cycle stages using as criteria the positioning of the DNA mass (top panel) and of cells with Tsr1-GFP at the extranucleolar body (bottom panel) in the indicated cell-cycle-arrested strains. The types of cell morphology and positioning of the DNA mass are depicted on the right. Note that the esp1-1 strain was analyzed when most cells are stalled at anaphase onset (esp1-1 cells undergo aberrant mitosis when incubated for a long time at 37°C).
