
FIGURE 3.
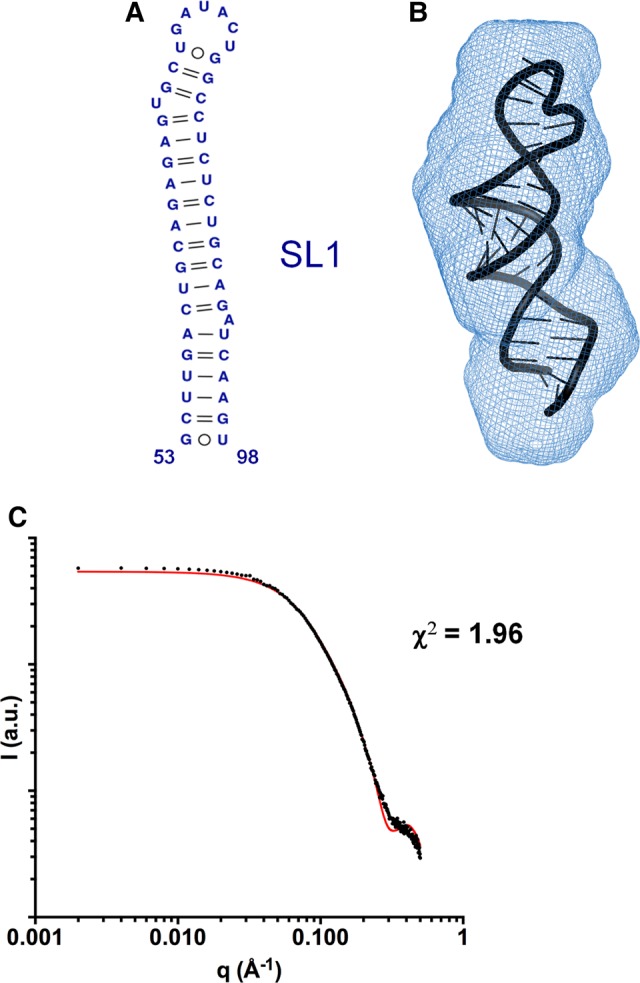
Three-dimensional structure of subdomain SL1 determined by SAXS. (A) Secondary structure of SL1 detected by NMR spectroscopy at low and higher salt concentration (Cantero-Camacho and Gallego 2015). (B) Average ab initio envelope of SL1 calculated from the SAXS profile at low ionic strength, superposed with the best energy-minimized SL1 atomic model, selected by fitting the theoretical SAXS profiles to the experimental curve. The normalized spatial discrepancy (NSD) between scattering envelopes was 0.624. (C) Theoretical SAXS profile calculated from the best energy-minimized SL1 atomic model (red line), overlaid with the experimental profile obtained at low ionic concentration (black dots).