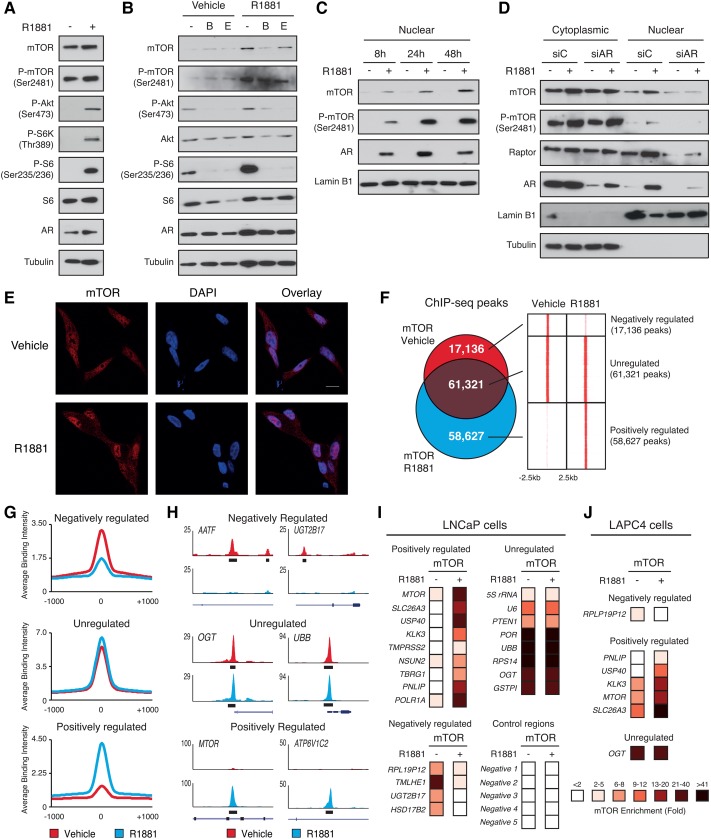
Figure 1.
Cytoplasmic and nuclear mTOR activities are induced by androgen signaling. (A) Protein expression of components of the mTOR signaling pathway and AR in whole-cell lysates from LNCaP cells after a 48-h treatment with R1881 or vehicle. Tubulin is shown as a loading control. (B) Protein expression of components of the mTOR signaling pathway in whole-cell lysates from LNCaP cells after a 48-h treatment with R1881 and/or anti-androgens (bicalutamide [B] and enzalutamide [E]). Tubulin is shown as a loading control. (C) Western blot analysis of nuclear fractions of LNCaP cells treated with R1881 or vehicle for various amounts of time. Lamin B1 is shown as a loading control. (D) Western blot analysis of cytoplasmic and nuclear fractions of LNCaP cells transfected with control or anti-AR siRNA and treated with R1881 or vehicle for 48 h. Lamin B1 and tubulin are shown as controls for nuclear and cytoplasmic extracts, respectively. (E) Immunofluorescence showing increased mTOR (red) levels in the nucleus following a 48-h treatment with R1881 in LCNaP cells. Nuclei were stained with DAPI (blue). (F) Overlap between mTOR DNA-binding peaks in LNCaP cells treated for 48 h with R1881 or vehicle and heat maps of the signal intensity of mTOR genomic binding peaks in a window of ±2.5 kb. (G) Average ChIP-seq (chromatin immunoprecipitation [ChIP] combined with high-throughput sequencing) signal intensities normalized per reads for down-regulated, unregulated, and up-regulated mTOR peaks. (H) Examples of University of California at Santa Cruz Genome Browser graphical views of mTOR-binding peaks in LNCaP cells treated with R1881 or vehicle that are either unaffected (unregulated) or positively or negatively regulated by androgens. Genes and peaks (black boxes) are indicated below tag density graphs. ChIP-qPCR (ChIP combined with quantitative PCR) of mTOR in LNCaP (I) or LAPC4 (J) cells after 48 h of treatment with R1881 or vehicle. Relative fold enrichment was normalized over two negative regions and is shown relative to IgG (set at 1). Results are shown as the average of three independent experiments.

