Figure 4.
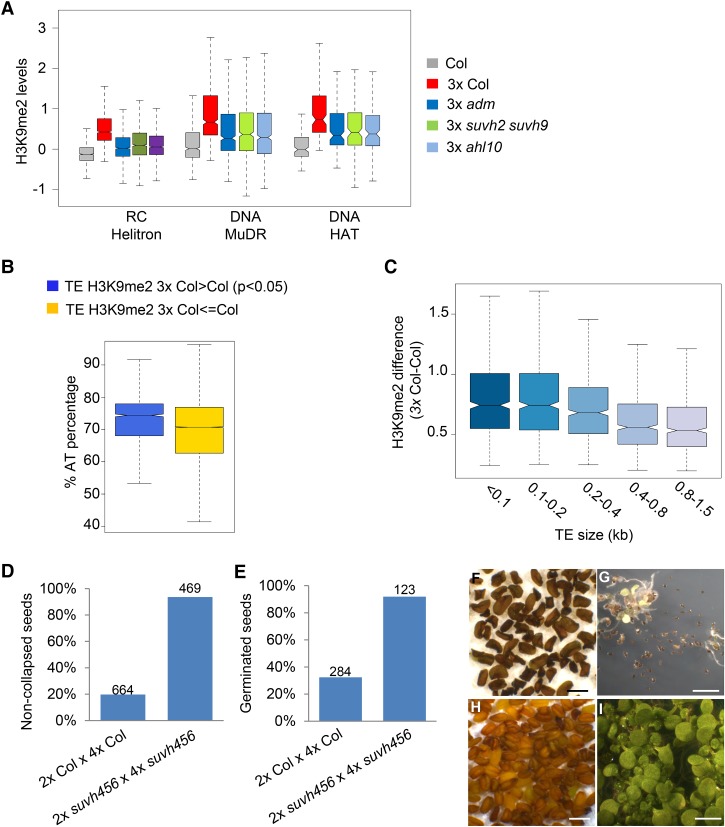
ADM-dependent ectopic application of H3K9me2 in 3× seeds. (A) Box plots showing median values of z-score-normalized H3K9me2 at TEs belonging to the indicated families in the endosperm of seeds derived from crosses Col × Col (Col), Col × osd1 (3× Col), Col × osd1 adm (3× adm), Col × 4× suvh2 suvh9 (3× suvh2 suvh9), and Col × 4× ahl10 (3× ahl10). Shown are TEs that significantly gain H3K9me2 in 3× Col. limma, P < 0.05. Reduced H3K9me2 in the endosperm of the indicated mutants compared with 3× Col is significant. Kolmogorov-Smirnov test, P < 10E−5. (B) Box plots showing median values of AT percentage within specified groups of TEs. The difference is significant. Kolmogorov-Smirnov test, P < 10E−15. (C) Box plots showing median values of H3K9me2 differences within TEs of the indicated sizes. The difference between the first and last two categories is significant. Kolmogorov-Smirnov test, P < 10E−15. (A–C) Boxes show medians and the interquartile range, and error bars show the full range excluding outliers. (D) The percentage of noncollapsed seeds of the indicated genotypes. The numbers above the bars correspond to the numbers of analyzed seeds. (E) The percentage of germinated seeds of the indicated genotypes. The numbers above the bars correspond to the numbers of analyzed seeds. (F) Picture of mature seeds derived from the cross 2× Col × 4× Col. Bar, 1 mm. (G) Picture of 3× Col seedlings 7 d after germination. Bar, 1 cm. (H) Picture of mature seeds derived from the cross 2× Col × 4× suvh456. Bar, 1 mm. (I) Picture of 3× suvh456 seedlings 7 d after germination. Bar, 1 cm.

