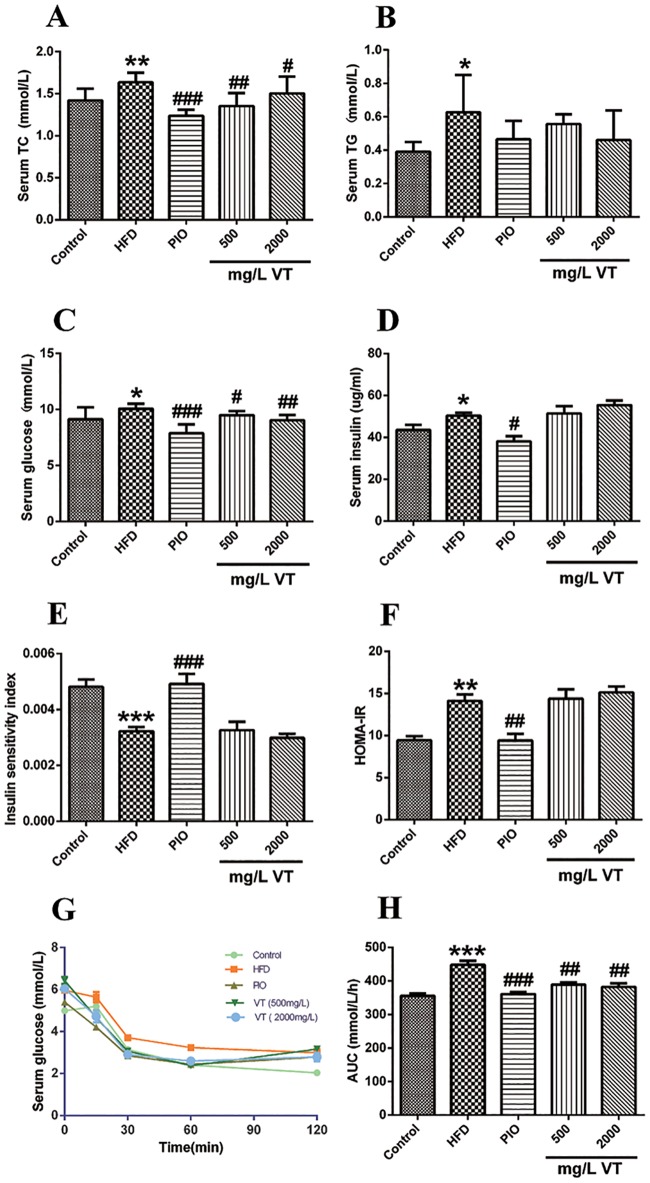
Fig 1. Effect of vine tea (VT) and pioglitazone (PIO) on serum glucose and lipid profiles in rats.
At the end of 8 weeks, TC (A), TG (B), fasting blood glucose (C) and insulin (D) were measured. The calculated insulin sensitivity index (E) and HOMA-IR index (F) are displayed. ITT: Blood samples were collected from tail veins for glucose measurement at 0, 30, 60, 90 and 120 min after insulin injection (ii) (G). The calculated AUC is depicted (H). Data are presented as the means ± SEM. *P<0.05, **P<0.01, ***P<0.001 compared to normal control; #P<0.05, ##P<0.01, ###P<0.001 compared to the HFD model group, n = 8.

