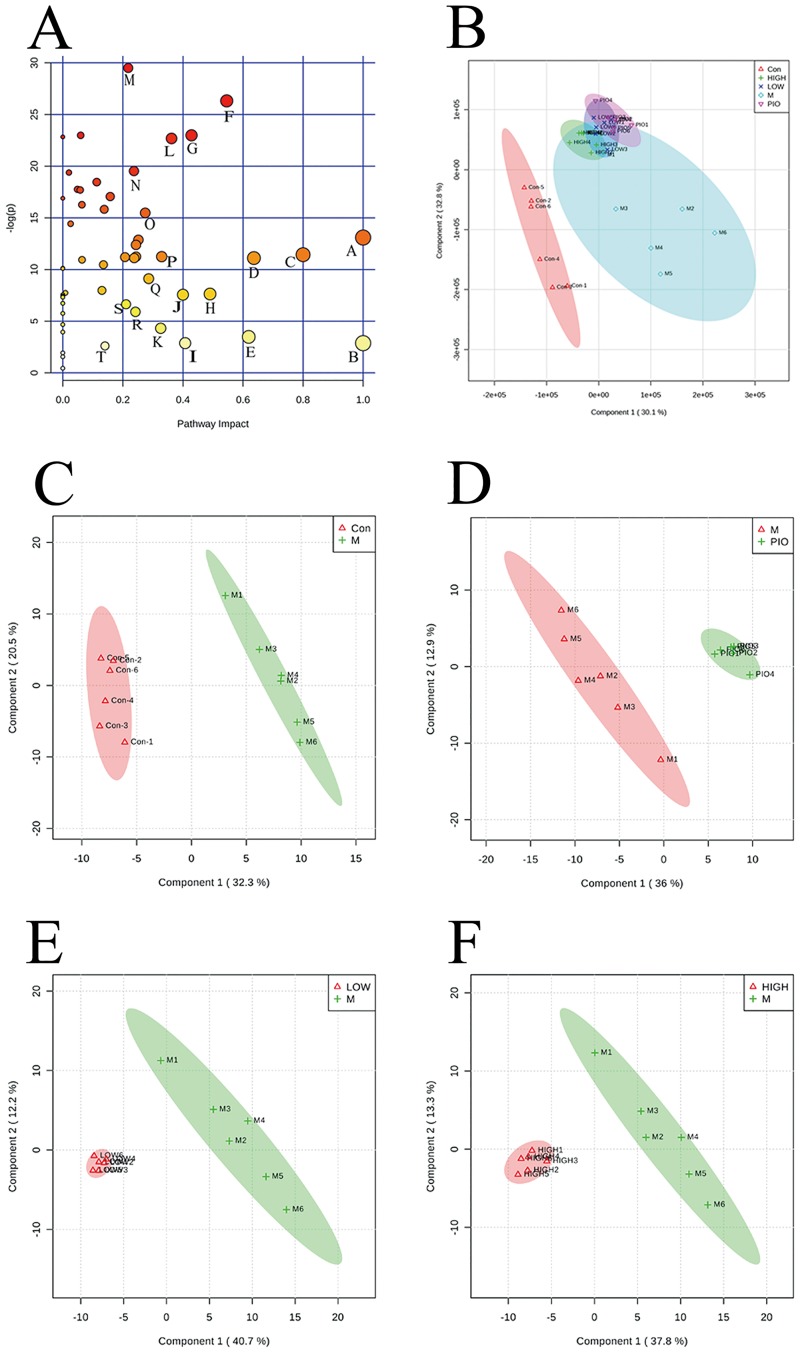
Fig 3. Vine tea (VT) regulated the disturbed metabolism induced by a high fat-diet (HFD) in rats.
Partial least-squares discriminant analysis (PLS-DA) score plots for HPLC/MS data of all the groups (A). PLS-DA score plots showed differences in the metabolic state in the control group (Con, Δ), the HFD model group (M, ◇), the pioglitazone groups (PIO,▽), the 2000 mg/L VT group (HIGH, +), and the 500 mg/L VT groups (LOW, ×). PLS-DA score plot showing the difference in the metabolic state between the control group (Con, Δ) and the HFD model group (M, +) (B). PLS-DA score plot showing the difference in the metabolic state between the HFD model group (M, Δ) and the PIO group (PIO, +) (C). PLS-DA score plot showing the difference in the metabolic state between the 500 mg/L VT groups (LOW, Δ) and the HFD model group (M, +) (D). PLS-DA score plot showing the difference in the metabolic state between the 2000 mg/L VT group (HIGH, Δ) and the HFD model group (M, +) (E). Summary of pathway analysis with MetPA (F). n = 6.

