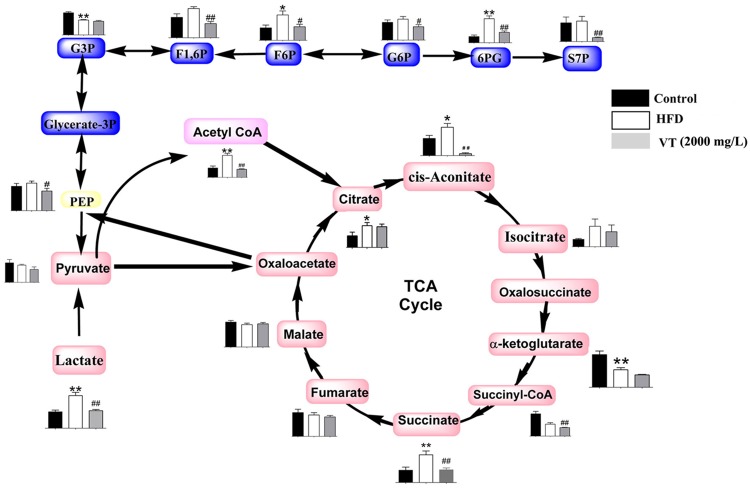
Fig 4. Metabolome pathway map of the quantified metabolites, including the components of glycolysis and the Krebs cycle in each group.
Black bar: control group (rats receiving only common chow); white bar: high fat-diet (HFD) group (rats receiving only an HFD); gray bar: vine tea (VT) group (VT, 2000 mg/L, and HFD). Data are presented as the means ± SEM. *P<0.05, **P<0.01 compared to normal control; #P<0.05, ##P<0.01 compared to HFD model group, n = 6.

