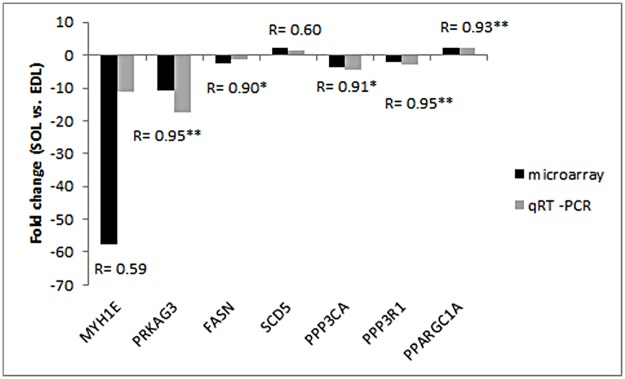
Fig 2. Difference of fold change in mRNA level of each gene between microarray and qRT-PCR analysis.
Fold changes were calculated as mRNA levels in SOL compared with EDL. Bars above X-axis indicate that genes were highly expressed in SOL, whereas those under X-axis indicate that genes were highly expressed in EDL. R indicates the Pearson correlation coefficient. * indicates significance level at P < 0.05; ** indicates significance level at P < 0.01.

