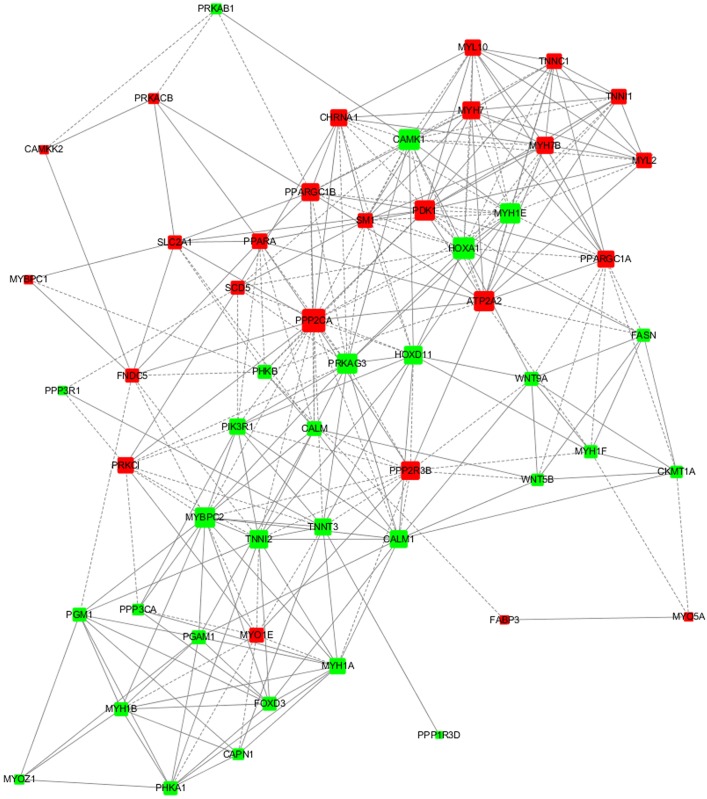
Fig 4. Coexpressed gene network for the selected DEGs.
Genes exhibiting upregulation are shown in red, whereas genes exhibiting downregulation are shown in green. The colour intensity indicates the degree of up/downregulation. Solid lines and dashed lines indicate positive correlation and negative correlation, respectively.

