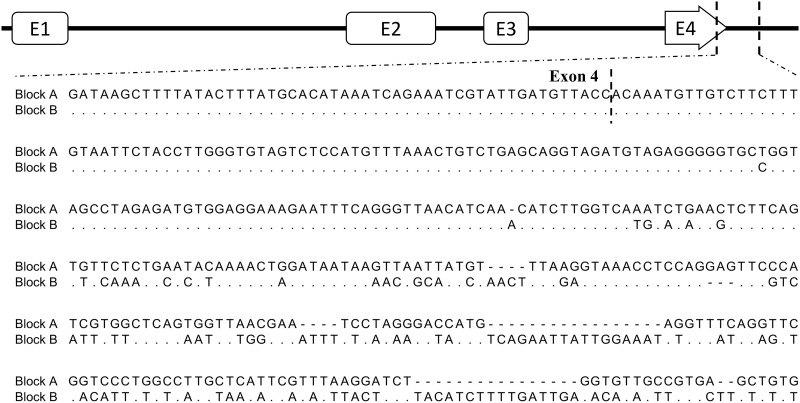
Fig 2. Comparison of the nucleotide sequences for the variable regions between the two copies of B2M genes.
The exon and intron structures of B2M are shown on top. The alignment results of the two sequences obtained from the direct sequencing are shown. The 420-bp diversity region corresponding to the end of exon 4 between the two duplicated B2M genes is shown.

