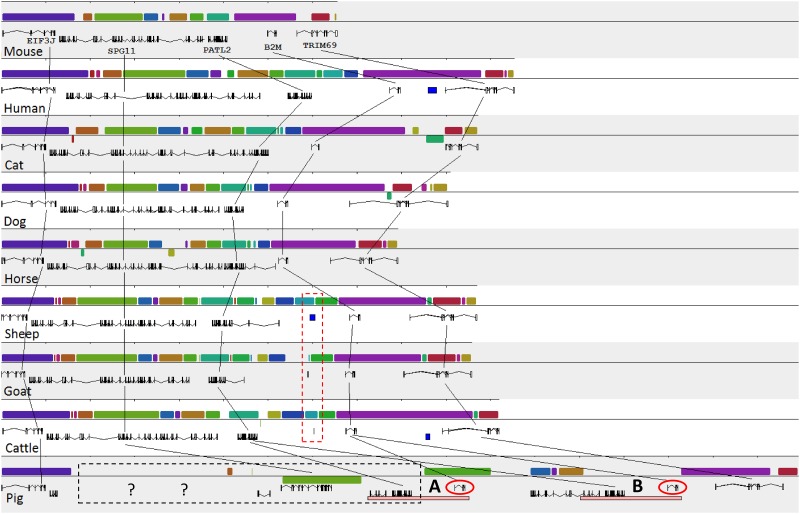
Fig 5. Comparison of the genetic structure of the EIF3J-TRIM69 interval among nine mammals.
The same colors indicate the corresponding elements in the genomes indicated by the lines. The exon and intron structures of the genes are shown under each element. The structure of the pig genome was based on the pig genome assembly Sscrofa10.2. The segmental duplications A and B in pigs are indicated by pink bars. The red dashed box indicates the partial sequences (~800 bp) of the B2M gene remnants in the cetartiodactyl species. The black dashed box with question marks indicates the low-confidence region from the current pig genome assembly (Sscrofa10.2), which shows discrepancy with our experimental data. The two B2M genes of pigs are indicated by the red circles.

