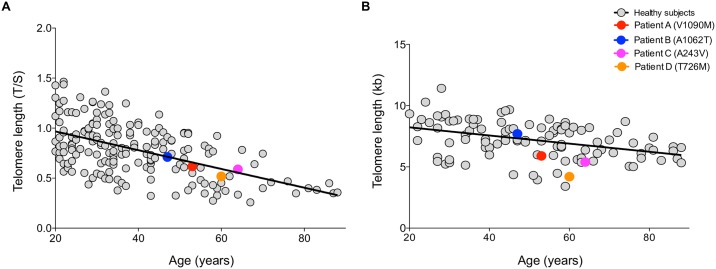
Fig 3. Distribution of age-matched telomere length in healthy subjects and HCC mutated patients.
Healthy subjects (n = 261) are represented as grey circles; patients carrying TERT variants (n = 4) are represented as colored circles. Telomere length given as (A) T/S ratio by qPCR (B) and kilobases (kb) by Southern blot.

