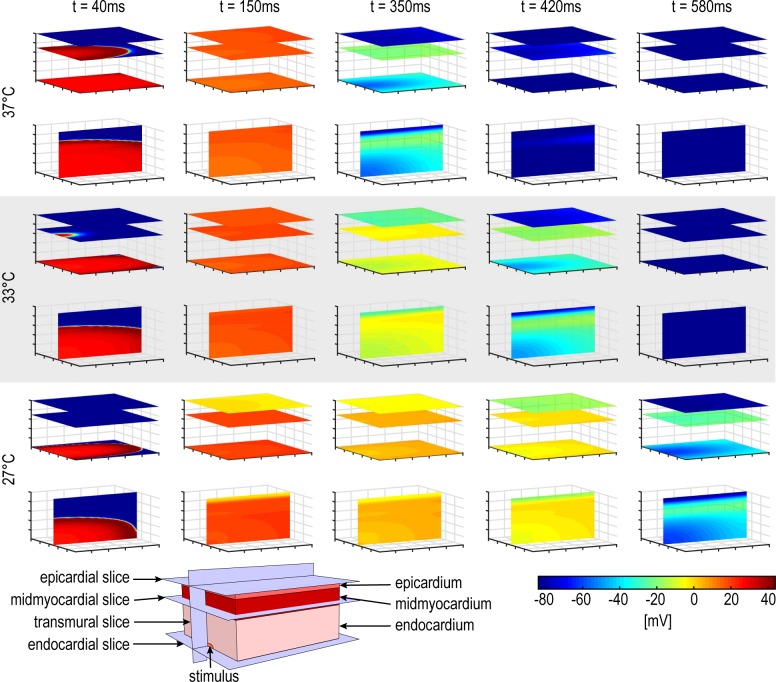
Fig 2. Visualization of excitation propagation of the simulated myocardial block for selected timestamps and temperatures.
The colors illustrate the cellular membrane potential, where dark blue represents repolarized cells and red the maximum depolarized cells (phase 1 of the AP). The dimension of the simulated myocardial block is 2x2x1cm where the thickness of the epicardial, midmyocardial and endocardial layers are 1mm, 3mm and 6mm, respectively. The stimulus was set in the middle of the left edge of the endocardium. The pictures include the visualized propagation of the outermost endocardial and epicardial layer respectively, the midmyocardial layer with the longest APDs (upper view each) and the transmural excitation in the middle of the block (bottom view each). At time point t = 40ms the hypothermal-induced slowed excitation propagation in all directions is evident. At t = 150ms the myocardial cells are in the plateau phase under normal and hypothermal conditions. A cooling- induced APD prolongation can be observed for the timestamps t = 350ms, t = 420ms and t = 580s where the epicardial layer reveals the shortest repolarization time followed by the endocardial and midmyocardial layer.

