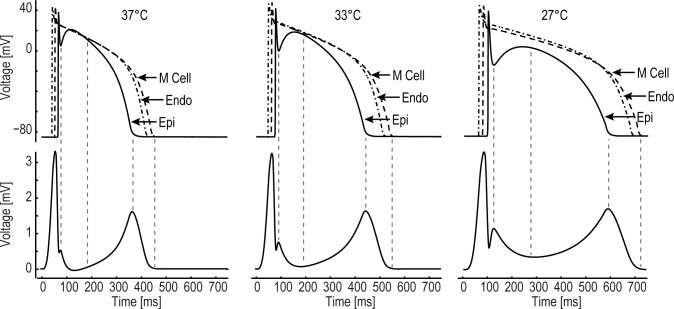
Fig 3. Correlation of the voltage gradients between the myocardial layers and the T wave morphology.
Top: Transmembrane action potentials (AP) representing the outermost epicardial and endocardial layers and the midmyocardial layer with the longest APD for different temperatures of 37°C, 33°C and 27°C. Bottom: calculated pECG across the simulated block. Additionally, a coincident time behavior of the epicardial notch and electrocardiographic J wave as well as repolarization of distinct cell layers and T wave are clearly evident.

