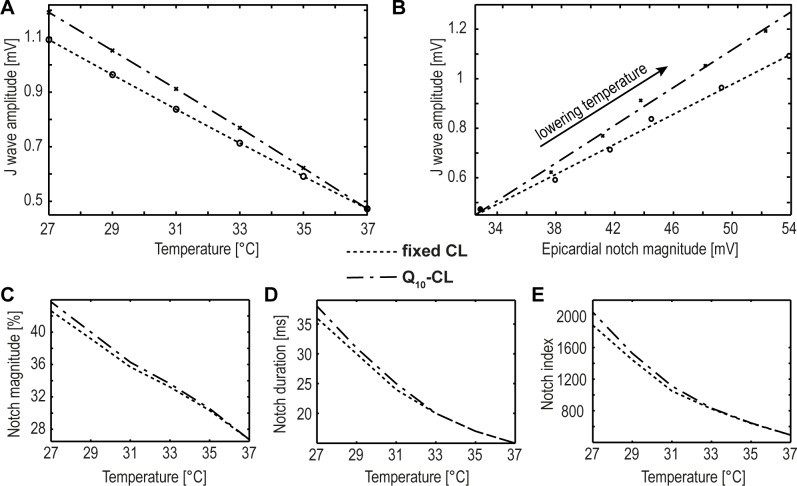
Fig 5. Effects of temperature on epicardial AP notch and J-wave.
(A) Correlation between J wave amplitude and temperature. (B) Correlation between J wave amplitude and amplitude of the epicardial notch when decreasing the temperature from 37° down to 27°C. The dotted lines indicate the linear regression curves (r = -0.99 (A), r = 0.99 (B)). In both experiments the J wave amplitudes were determined based on the simulated transmural pECG for both the fixed CL and temperature dependent Q10-CL. Notch magnitude as percentage of phase 0 amplitude (phase 1 magnitude/phase 0 amplitude ×100) (C), notch duration (D) and notch index (E) increase significantly during cooling.

