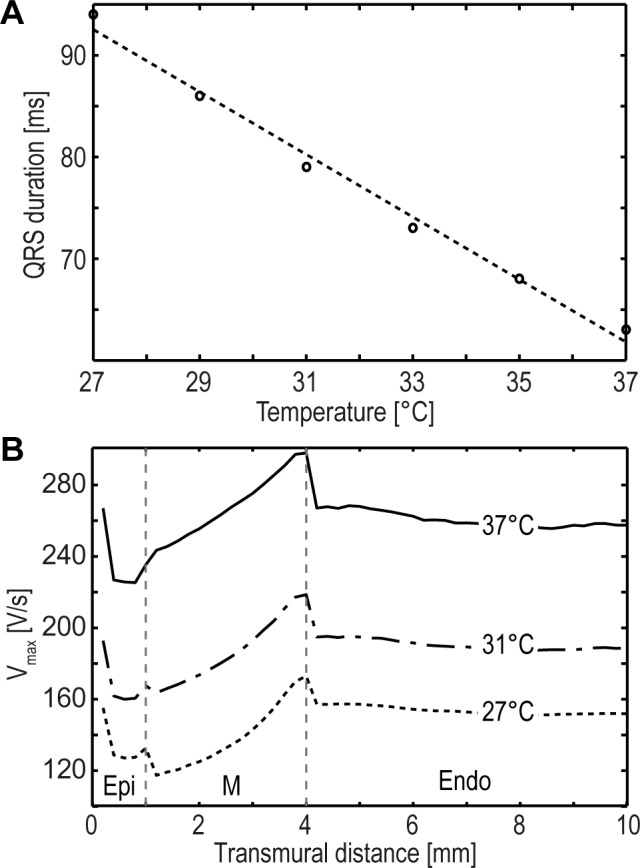
Fig 6. Effects of temperature on QRS interval and Vmax.

(A) Correlation between QRS duration and temperature. A cooling-induced prolongation of the QRS interval is evident. The dotted line represents the linear regression curve (r = -0.99, p<0.01). (B) Transmural distribution of Vmax for different temperatures (37°C, 31°C, 27°C). The cooling-induced decrease of Vmax for all cellular regions is obvious. Additionally, the heterogeneity of Vmax based on divergent cell types is shown where the M region yields the highest Vmax value followed by the endocardium and the epicardium.
