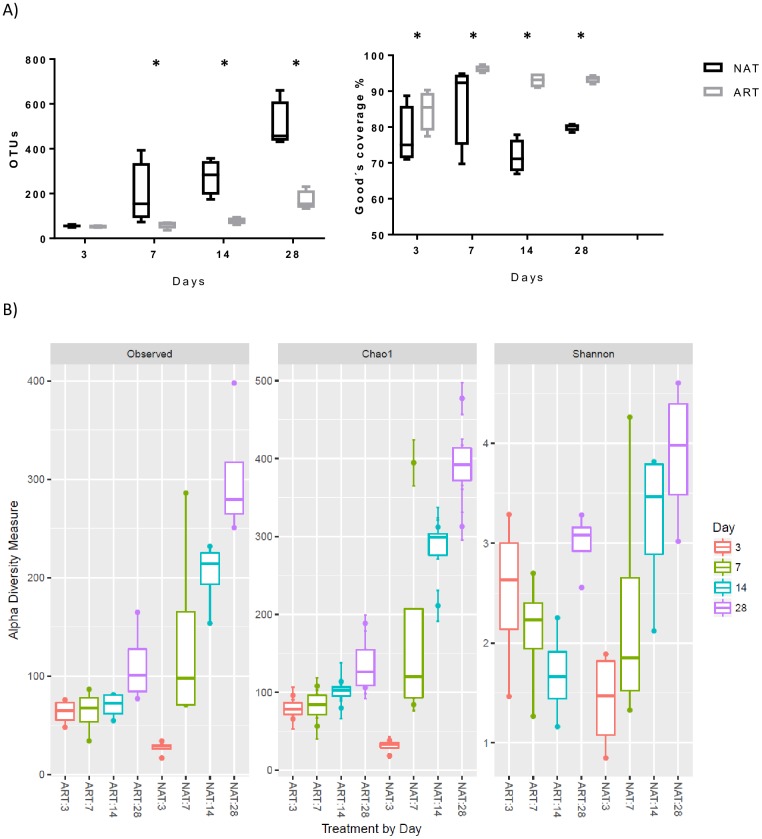
Fig 1. Alpha diversity measures for rumen bacteria across different feeding system the first month of life.
Total Observed taxonomic units, Chao1 estimates and Shannon diversity index. Boxplots indicate the first and third quartiles with the median value indicated as a horizontal line the whickers extend to 1.5 times the inter quartile range. NAT, natural; ART, artificial feeding management.

