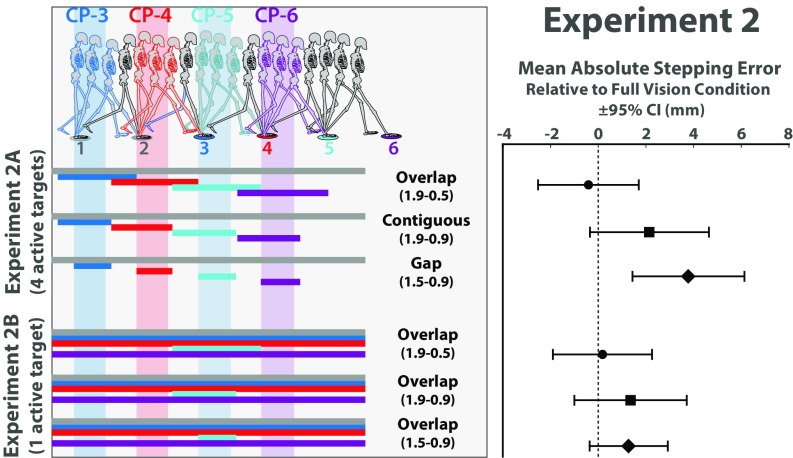
Fig. 3.
(Left) Depiction of target visibility manipulations used in experiments 2A (Top) and 2B (Bottom). See Movies S3 and S4. Horizontal bars indicate the location of the walker’s COM when the target of the corresponding color was visible. Vertical bands indicate hypothesized critical control phase for each target. The same three visibility manipulations were used in both experiments but were applied to targets 3–6 in experiment 2A and to targets 4 or 5 in experiment 2B. (Right) Mean absolute stepping error relative to full vision control condition and 95% CI for each condition in experiments 2A and 2B.

