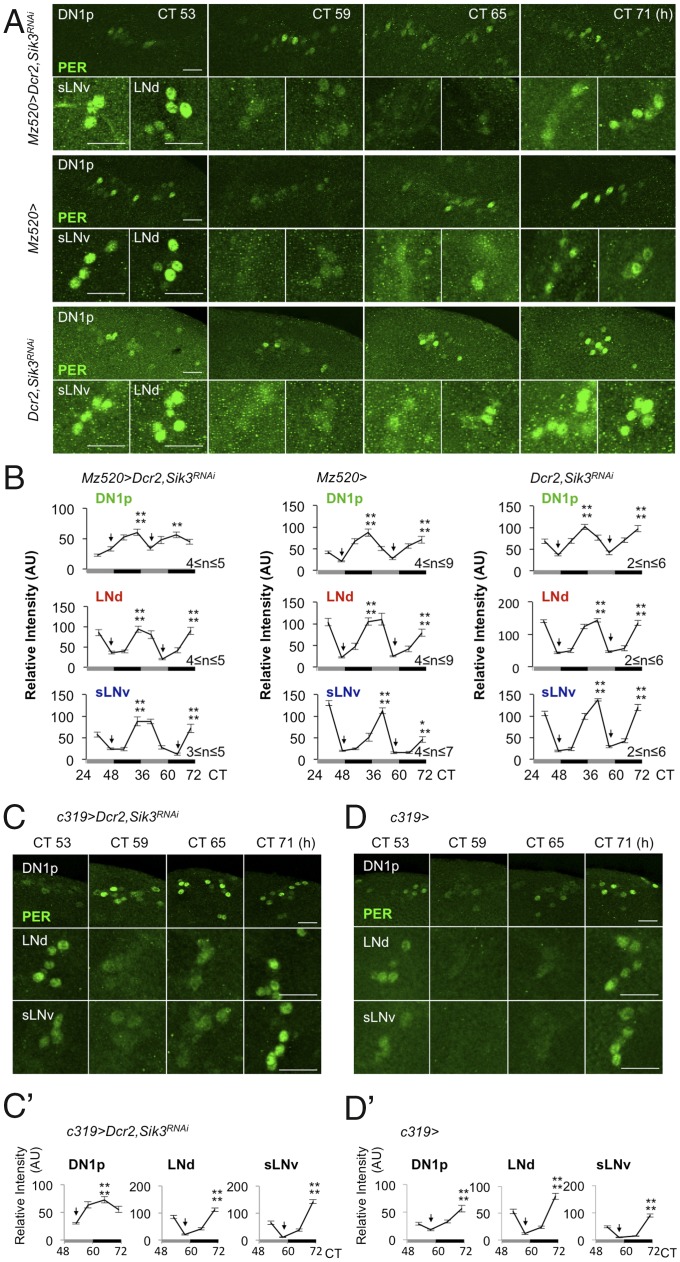
Fig. 2.
Sik3 knockdown in M cells or DN1 neurons changes the amplitude or phase of PER cycling in DN1ps. (A) PER expression in clock neurons of brains from flies of the indicated genotypes kept in DD were stained with anti-PER antibody at four time points in the third subjective day and night. (Scale bar: 10 μm.) (B) Relative intensity of PER expression in DN1ps (Top), LNds (Middle), and sLNvs (Bottom). The values at all peaks are significantly higher than the values at the troughs (arrows). n indicates the number of hemispheres measured. A second, independent experiment yielded similar results (Fig. S6A). Error bars represent the SEM. **P < 0.01 and ****P < 0.0001 (one-way ANOVA followed by Tukey’s multiple comparison test). AU, arbitrary units (C and D) The indicated genotypes were stained as in A at four time points in the third subjective day and night. (Scale bar: 10 μm.) (C′ and D′) Relative intensity of PER expression as described in B (4 ≤ n ≤ 6). Error bars represent the SEM. ****P < 0.0001 (one-way ANOVA followed by Tukey’s multiple comparison test).

