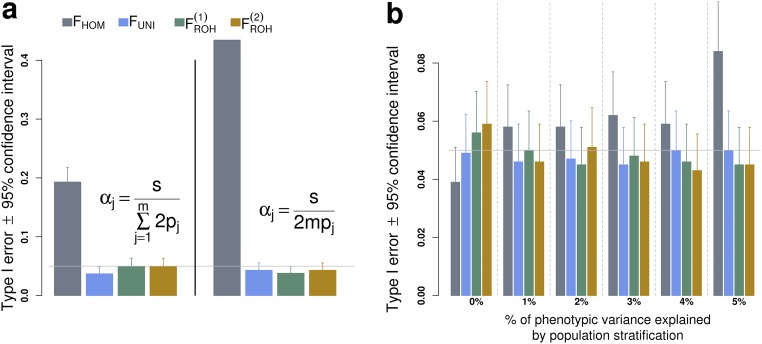
Fig. S5.
Type I error rate associated with the detection of ID. Type I error rate is measured as the fraction of P values from 1,000 simulated datasets. In A datasets were simulated assuming no ID; i.e., and nonnegative expectation for the additive effects (i.e., , for the th causal variant). In B datasets were simulated assuming no ID () and no directional effect of minor alleles (), but including the contribution of the first 10 genotypic PCs to model the effect of PS. Abbreviations are as defined in Fig. S2.

