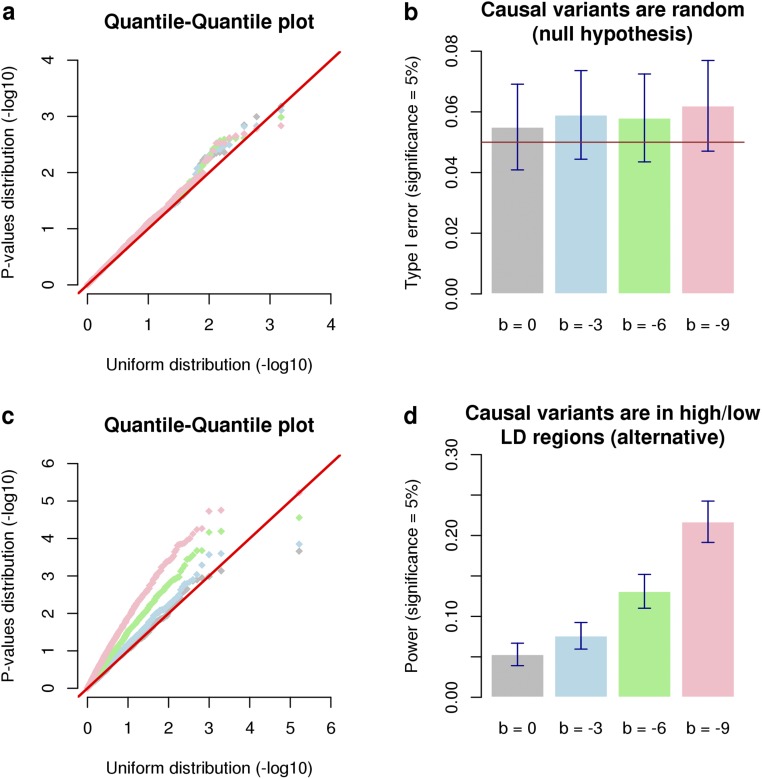
Fig. S7.
P-values distribution of the LD and MAF heterogeneity test. P values were calculated on data generated in simulation 1. A and B correspond to the null hypothesis () of no LD or MAF heterogeneity between SNPs and causal variants. C and D correspond to the alternative hypothesis () of LD and MAF heterogeneity between causal variants and SNPs. A and C compare via a quantile–quantile plot the P-value distribution to the uniform distribution between 0 and 1. B and D represent, for different values of the true inbreeding depression used to simulate the data (, −3, −6, and −9), the proportion of those P values smaller than 0.05.

