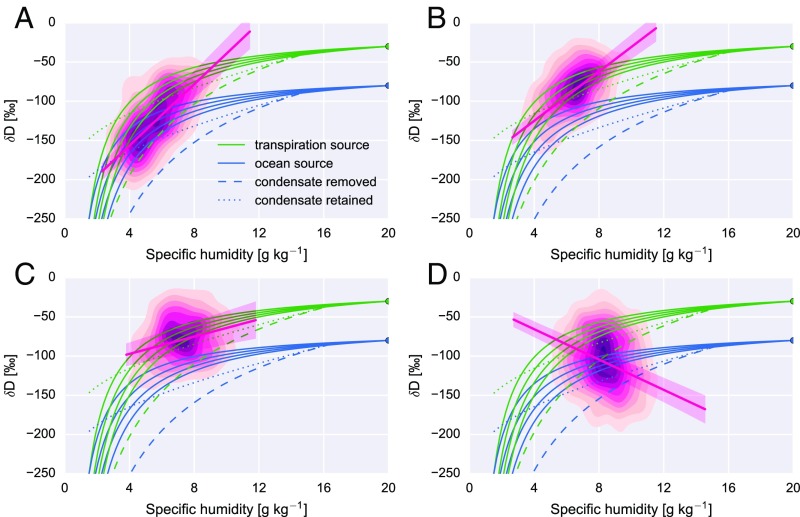
Fig. 3.
Joint distributions of specific humidity () and the deuterium content of water vapor (D) in the lower troposphere (825–600 hPa) based on TES observations during the pretransition stage (day −90 to −60) (A), early transition (day −60 to −30) (B), late transition (day −30 to 0) (C), and the first 3 mo of the wet season (day 0 to +90) (D). The joint behaviors of and D under three types of idealized vertical mixing are also shown. Solid green and blue lines represent mixing (no condensation) between four dry air masses representing the dry season free troposphere and a moist air mass representing either local ET (green; = 20 g kg−1; D = −30‰) or ocean evaporation (blue; = 20 g kg−1; D = −80‰). Dashed green and blue lines represent pseudoadiabatic Rayleigh distillation from the approximate top of the ABL, in which condensation occurs in a rising air parcel and is immediately removed as precipitation. Dotted green and blue lines represent reversible moist adiabatic ascent from the approximate top of the ABL, in which condensation occurs and is assumed to remain in the parcel. These idealized models are described in detail in SI Text.

