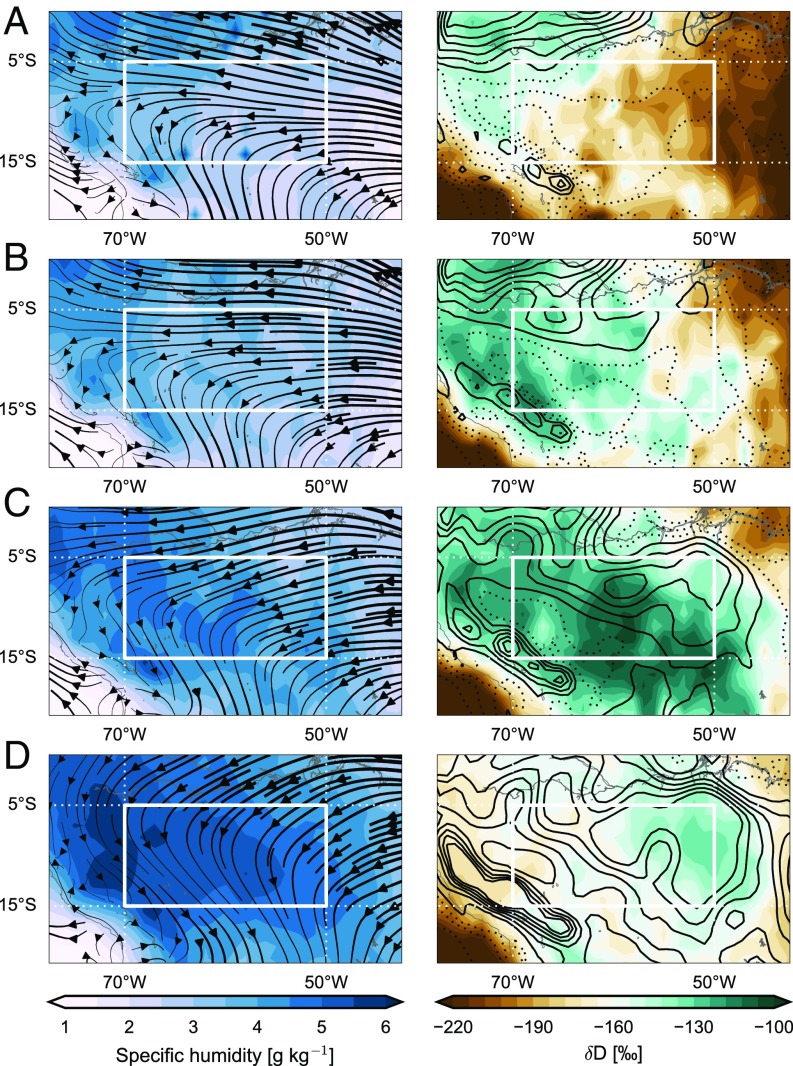
Fig. 4.
Distribution of specific humidity (Left) and D (Right) in the free troposphere based on TES observations during the pretransition (day −90 to −60) (A), early transition (day −60 to −30) (B), late transition (day −30 to 0) (C), and early wet season (day 0 to +90) (D). Winds at 850 hPa (Left) and vertically integrated MFC (Right) based on ERA-Interim are also shown for each stage of the transition. The contour interval for MFC is 1 kg m−2 d−1.

