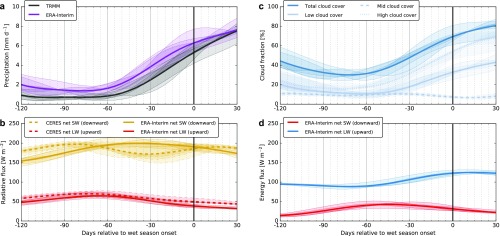
Fig. S1.
Onset-relative time series of precipitation from TRMM and ERA-Interim (A), net fluxes of shortwave (downward) and longwave (upward) radiation at the surface from ERA-Interim and CERES SYN1Deg (B), cloud fraction from ERA-Interim (C), and upward sensible and latent heat fluxes from ERA-Interim (D). All fluxes represent area-weighted averages over the southern Amazon region during the period 2005–2011. Uncertainties represent interannual variability across six dry-to-wet transition seasons.

