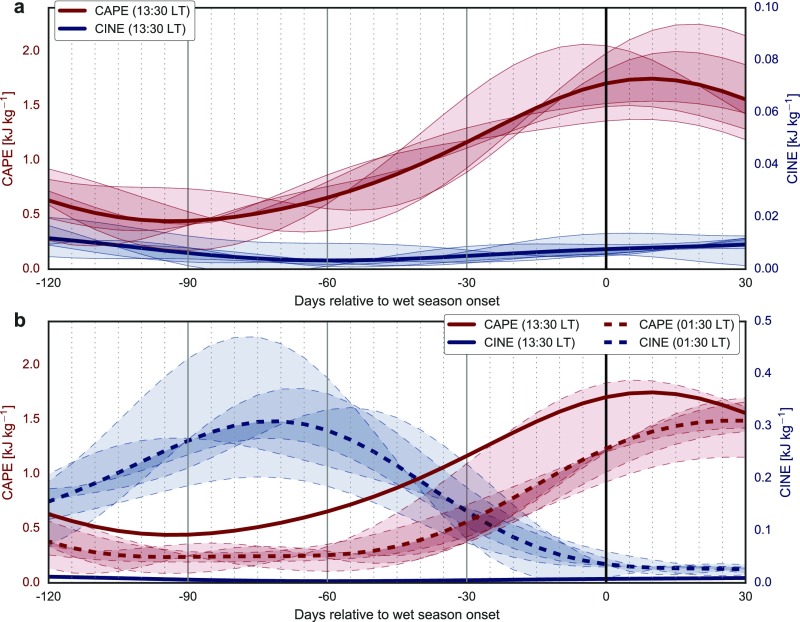
Fig. S3.
Onset-relative composite time series of area-weighted 5-d mean CAPE (red lines) and CINE (blue lines) calculated from daily AIRS profiles of temperature and water vapor during ascending (daytime) (A) and descending (nighttime) (B) orbits. Larger values of CAPE indicate greater convective instability, whereas larger values of CINE indicate a larger energetic barrier to convection. Note different ranges of the CINE axis between A and B. Mean evolution of daytime values are shown in B to facilitate comparison. Uncertainties represent interannual variability across six dry-to-wet transition seasons.

