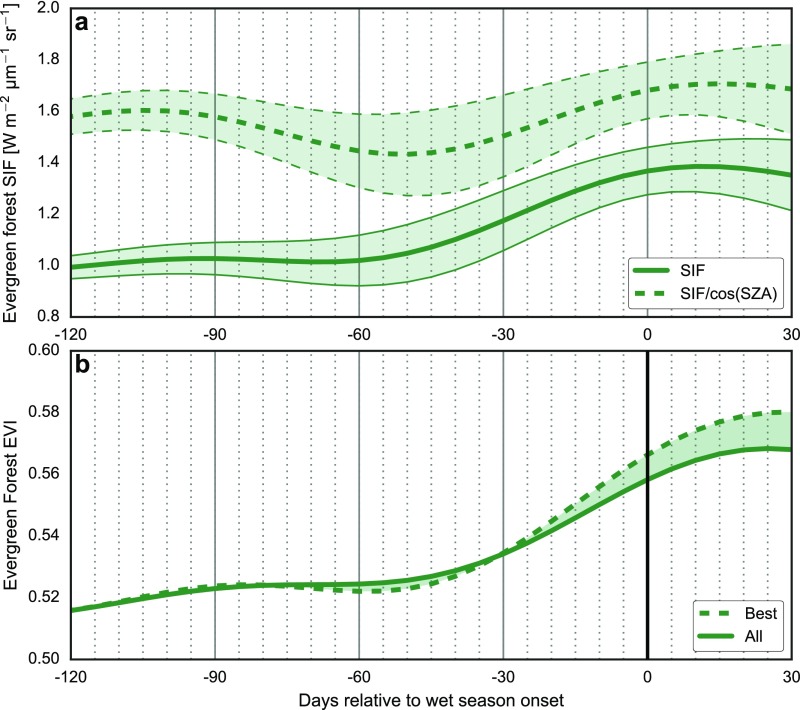
Fig. S4.
Onset-relative time series of SIF from GOME-2 observations (A) and EVI calculated from MODIS observations (B). Two variations of SIF are shown, both covering the time period 2007–2014. The raw SIF data (solid line) are identical to those shown in Fig. 2E. SIF normalized by the cosine of the solar zenith angle (dashed line) is also shown for context and comparison with EVI. Uncertainty windows in both SIF estimates reflect interannual variability quantified as SDs across seven dry-to-wet transition seasons. The EVI data cover the time period 2005–2011, consistent with all non-SIF data shown in Fig. 2. Again, two variations are shown, one based on strict quality control standards (dashed) and one based on minimum quality control standards (solid; see SI Text, Vegetation Metrics and Fire Emissions for details). On average, late dry season increases in EVI lag late dry season increases in SIF by 10 15 d.

