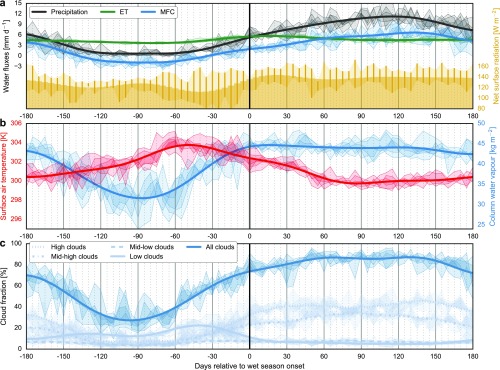
Fig. S7.
Full onset-relative annual cycle of precipitation from TRMM, ET, and moisture flux convergence from ERA-Interim, and net (downward) surface radiation flux at the surface from CERES SYN1Deg (A), surface air temperature and CWV from AIRS (B), and total and vertically-resolved cloud fraction from CERES SYN1Deg (C). Data from individual years are shown without low-pass filtering to illustrate the scale of the unfiltered variability.

