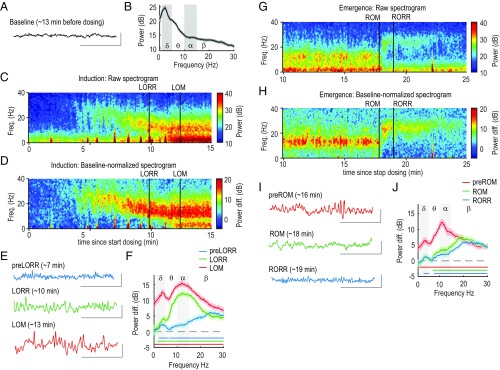
Fig. 1.
Sequence of changes in the prelimbic LFP during induction of and emergence from anesthesia. (A) Representative trace from a single electrode, recorded during baseline, and located in layer 6 of prelimbic cortex. Recordings from this electrode are used in examples throughout this figure. (B) Group spectra observed during baseline in prelimbic cortex across all layers and subjects (n = 27, eight rats). The shaded area represent 99% confidence intervals. (C) Representative spectrogram observed during induction of unconsciousness. Propofol dosing starts at t = 0, and the vertical black lines mark behavioral events (LORR and LOM). (D) Same spectrogram as in C, normalized by its own baseline (Materials and Methods). (E) Representative raw traces recorded during each of the behavioral events observed during induction. Vertical scale: 1,000 V. Horizontal scale: 1 s. (F) Peri-event, normalized group spectra corresponding to the same behavioral events shown in E. The horizontal lines mark the frequencies at which power is significantly different from baseline. (G) Representative spectrogram during emergence from unconsciousness. Propofol dosing stopped at t = 0 (not shown). The vertical black lines mark behavioral events (ROM and RORR). (H) Same spectrogram as in G, but normalized by its own baseline. (I) Representative raw traces recorded during each of the behavioral events observed during emergence. (J) Peri-event, normalized group spectra corresponding to the same behavioral events shown in I.

