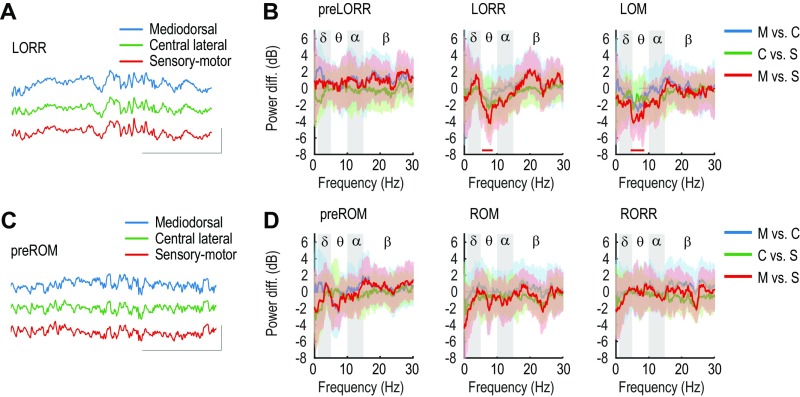
Fig. S4.
Differential effects of propofol within higher-order thalamic nuclei. (A and B) Difference in power between nuclei during induction of anesthesia. (A) Example raw traces observed during LORR from electrodes located in M (blue), C (green), and S (red) nuclei. (B) Baseline-normalized, group difference spectra at each behavioral event. The horizontal lines at the bottom signify the frequencies at which power is significantly different between nuclei. (C and D) Difference in power between nuclei during emergence from anesthesia. (C) Example raw traces observed during preROM from electrodes located in M, C, and S nuclei. Color code is the same as in A. (D) Baseline-normalized group spectra at each behavioral event. Color code is the same as in B. Shaded areas in all difference spectra represent 99% CIs. In the raw traces, the vertical scale corresponds to 1,000 V and the horizontal scale to 1 s.

