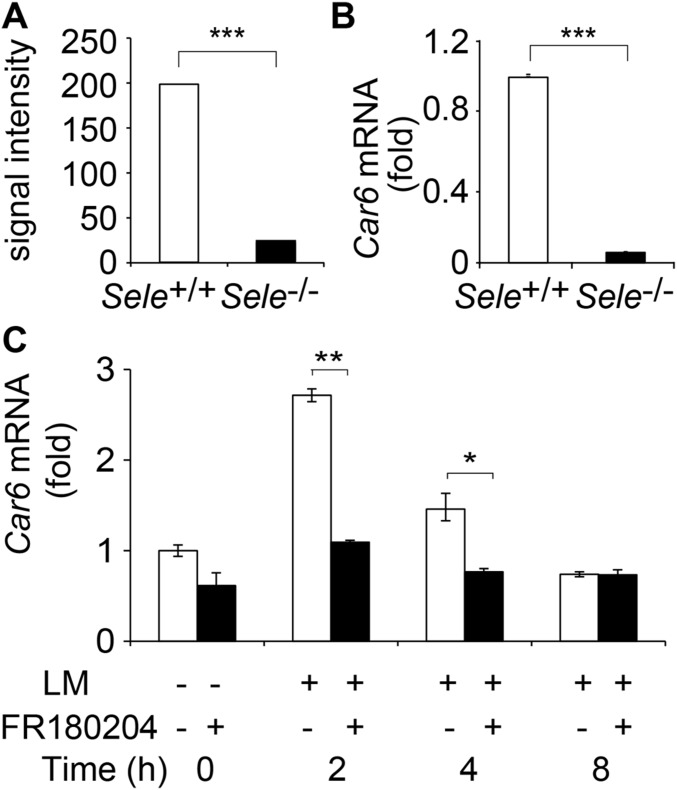
Fig. S1.
Car6 expression in Sele−/− mice. (A) The signal intensity of Car6 in cDNA microarray of PMs from Sele−/− and Sele+/+ mice infected with LM in vivo for 72 h. (B) Examination of Car6 expression stimulated as in A by qPCR assay. (C) Car6 expression in PMs from Sele+/+ mice after being pretreated by ERK-specific inhibitor FR180204 for 2 h and then stimulated by LM for the indicated time. Data were shown as mean ± SD (n = 3). *P < 0.05, **P < 0.01, ***P < 0.001.

