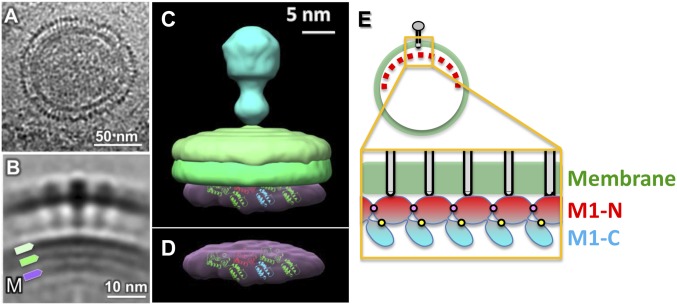
Fig. 4.
Cryoelectron tomography of the ISA virion. (A) Central slide from a tomogram of an ISA viral particle. (B) Averaged structure showing the ISA viral envelope. Triple-layered membrane densities are visible in A and B. (C) A 3D rendering of the averaged structure. The three layers of density are interpreted as the inner membrane leaflet, the outer membrane leaflet, and the matrix protein shell. A 3 × 3 ISAV-M1 crystal lattice is fitted into the matrix protein layer. (D) Isolated density corresponding to the matrix protein layer. (E) Schematic diagram showing M1 protein polymerization under the viral envelope. The formation of the matrix protein layer involved interactions between the M1 N and N domains (represented by pink dots) as well as the M1 N and C domains (represented by yellow dots).

