Fig. 8.
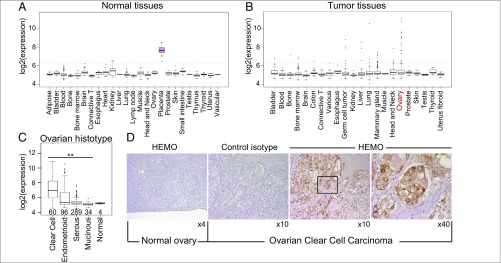
Microarray analysis of HEMO expression within normal tissues and tumor samples. (A and B) Box plot representations of normalized values obtained for HEMO gene expression extracted from the E-MTAB62 dataset (on a logarithmic scale). Original tissue categories were adjusted to group together samples from the same biological source, keeping the major groups described by the authors: normal tissues (A) and tumor samples (B). (C) Box plot representation of normalized values obtained from an enlarged ovarian tumor sample extracted as raw.CEL files from various AE and GEO studies (SI Methods). Values for normal ovarian tissues were included, as control, in the normalization process. Tumoral ovarian histotypes correspond to 60 clear cell carcinoma, 96 endometrioid, 34 mucinous, and 289 serous tumoral samples (Wilcoxon’s rank sum test). **P < 0.01. (D) Immunohistochemical analysis using the 2F7 mAb specific for the HEMO protein (or a control isotype) of formalin-fixed normal ovarian tissues (column 1) and ovarian clear cell carcinoma (column 2–4; at two magnifications).

