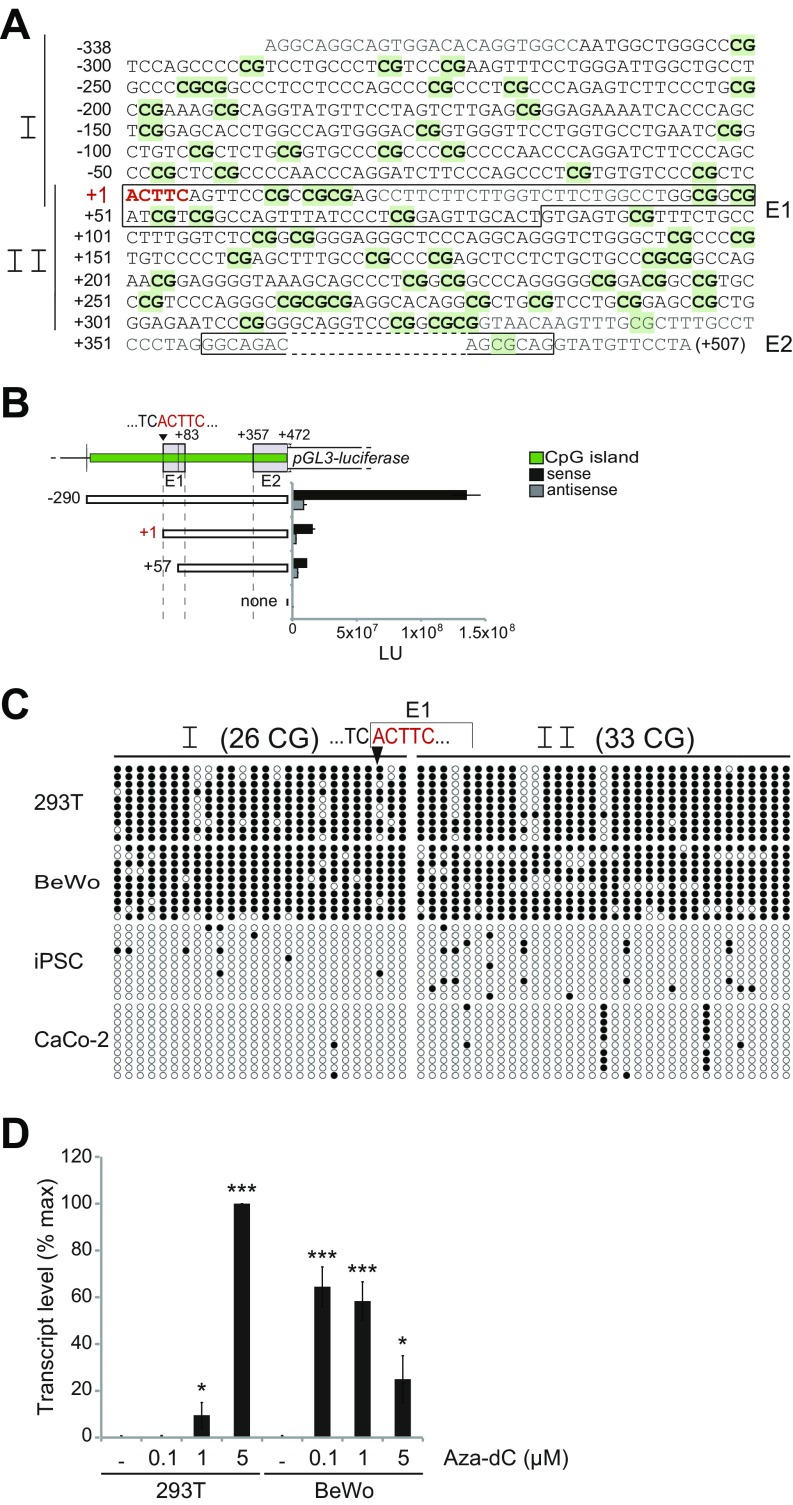
Fig. S1.
Characterization of the HEMO env gene promoter. (A) CpG island promoter sequence around the transcription start site (+1; ACTTC in red; position 52.751.425 on chromosome 4 of the GRCh38 assembly), with CG dinucleotides in green highlighted. Exon1 and exon2 are boxed. Nucleotide sequences in gray represent primer sequences used for amplification of the two fragments I and II (vertical bars on the left) and analyzed after bisulfite treatment (C). Primers listed in Table S3 are bisulfite-converted sequences. (B) Luciferase assay of the CpG island promoter. (Upper) Schematic representation of the promoter-luciferase constructs with the CpG island (green) containing exons E1 and E2. E2 was shortened at its 3′ end, 28 bp upstream of the donor splice site, to limit splicing out of the luciferase gene. (Lower) Promoter sequences in each pGL3 construct are indicated as white boxes, with coordinates relative to the +1 transcription start site of the gene. Control (none) corresponds to the basic pGL3 vector, with no inserted sequence. Promoter activity, expressed in light unit (LU), was determined using the Luciferase reporter assay in lysates from 293T cells transfected with the pGL3 vectors. The plotted data are the average from three independent experiments. (C) Methylation status of the HEMO promoter region as revealed by bisulfite treatment of the genomic DNA from cell lines not expressing (293T and BeWo cells) or expressing (iPSC and CaCo-2) the HEMO gene, and PCR amplification of fragments I (containing 26 CpG) and II (containing 33 CpG) delineated. The graph represents the sequencing of 10 clones for each PCR-amplified fragment, with methylated (black circles) and unmethylated (white circles) CpG indicated. (D) Effect of DNA demethylation on expression of the HEMO gene. HEMO gene transcription levels were detected by qRT-PCR and normalized to the housekeeping gene RPLP0 in cell lines (293T, BeWo) untreated (DMSO alone) or treated with 0.1–5 μM 5-Aza-dC for 3 d. Data are presented as the mean ± SEM. Asterisks indicate values significantly different from those obtained with untreated cells (unpaired two-tailed t test). *P < 0.05; ***P < 0.001.

