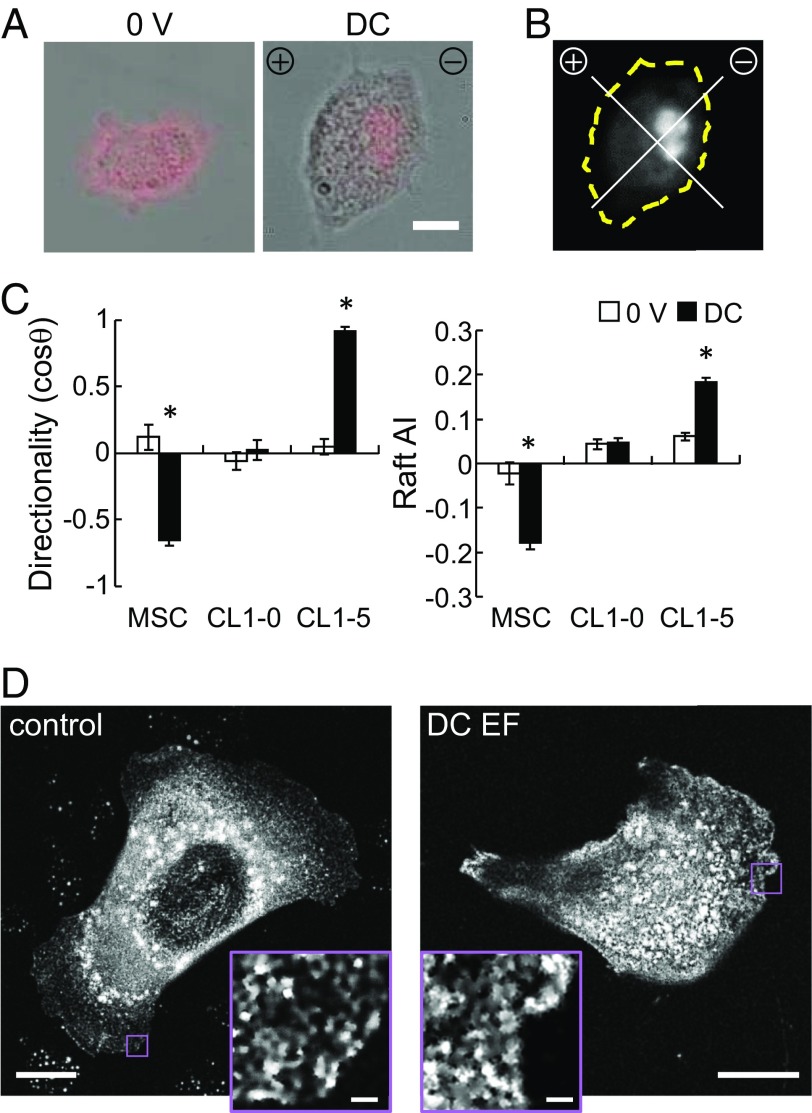
Fig. 1.
Applied EF directs cell migration and lipid raft polarization. (A) Sample lipid raft labeling with CtxB. (Scale bar, 10 μm.) (B) Schematic for AI calculation, which was calculated as the difference of normalized fluorescent intensity between the region toward the cathode and the anode. (C) Galvanotactic behaviors of hMSC, CL1-0, and CL1-5 cells, and lipid raft distribution after 1 h of exposure to DC EF (n = 51–265, *P < 0.0001 vs. 0 V). (D) Superresolution microscopy images of representative cells labeled with CTxB for lipid raft. [Scale bar, 10 μm and (Inset) 1 μm.]

