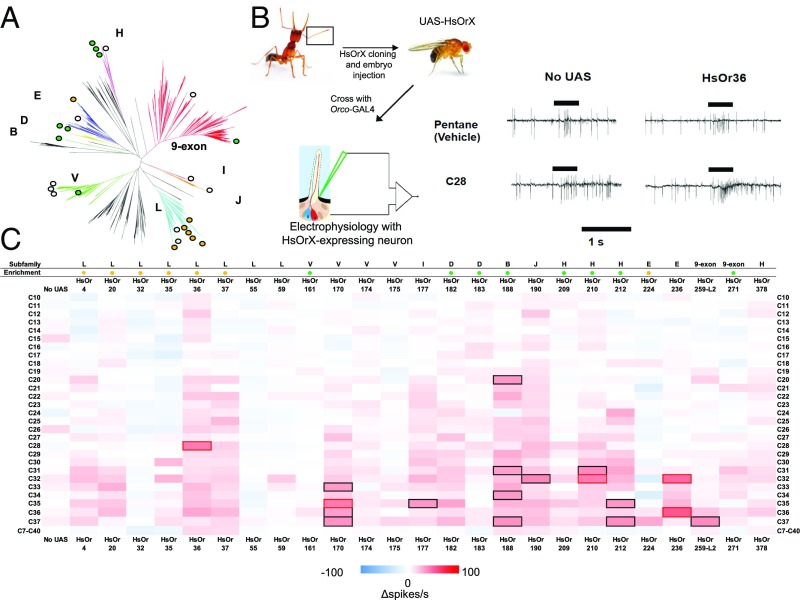
Fig. 1.
SSR responses of HsOR receptors to 28 cuticular hydrocarbons and a hydrocarbon mixture. (A) Summary of the phylogenetic relationship of the HsOr subfamilies and the receptors examined in this study. (B) Schematic summarizing SSR technique, along with sample traces comparing responses to heated control (pentane) with responses to heated cuticular hydrocarbons. (C) Heat map of responses in ab2A neurons to each hydrocarbon. Responses are calculated as the change in spike frequency induced by each stimulus, relative to the prestimulus spike frequency (after subtraction of the pentane control). The subfamily identity for each HsOr is indicated at the top, along with enhanced transcript abundance (9) for workers (orange dots) and males (green dots). Responses above 30 spikes per s are indicated by black boxes, and responses above 40 spikes per s are indicated by red boxes.

