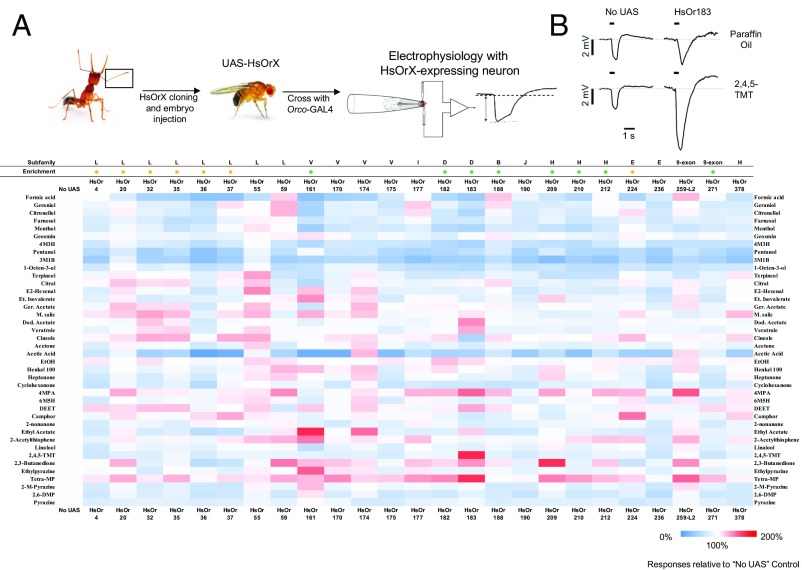
Fig. 4.
EAG responses of HsOR receptors to volatile odorants. (A) Schematic summarizing electroantennogram recording technique, along with sample traces comparing responses to diluent alone (paraffin oil) and the volatile odorant 2,4,5-trimethylthiazole. (B) Heat map of EAG responses. Data shown is the same as Fig. S2, with an additional round of normalization to the no-UAS control line. Responses are a percentage value relative to the no-UAS line.

