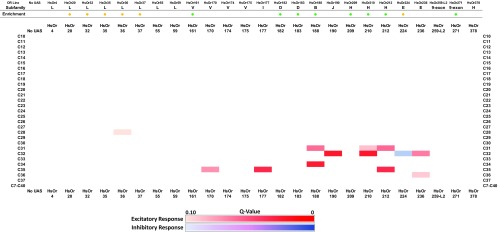
Fig. S1.
Statistical analysis of SSR responses to CHCs. Analysis was conducted by using one-way ANOVA, followed by correction for multiple comparisons using a two-stage FDR method (17) with a threshold of q < 0.10. Significant excitatory responses are indicated in red, and inhibitory hits are indicated in blue.

