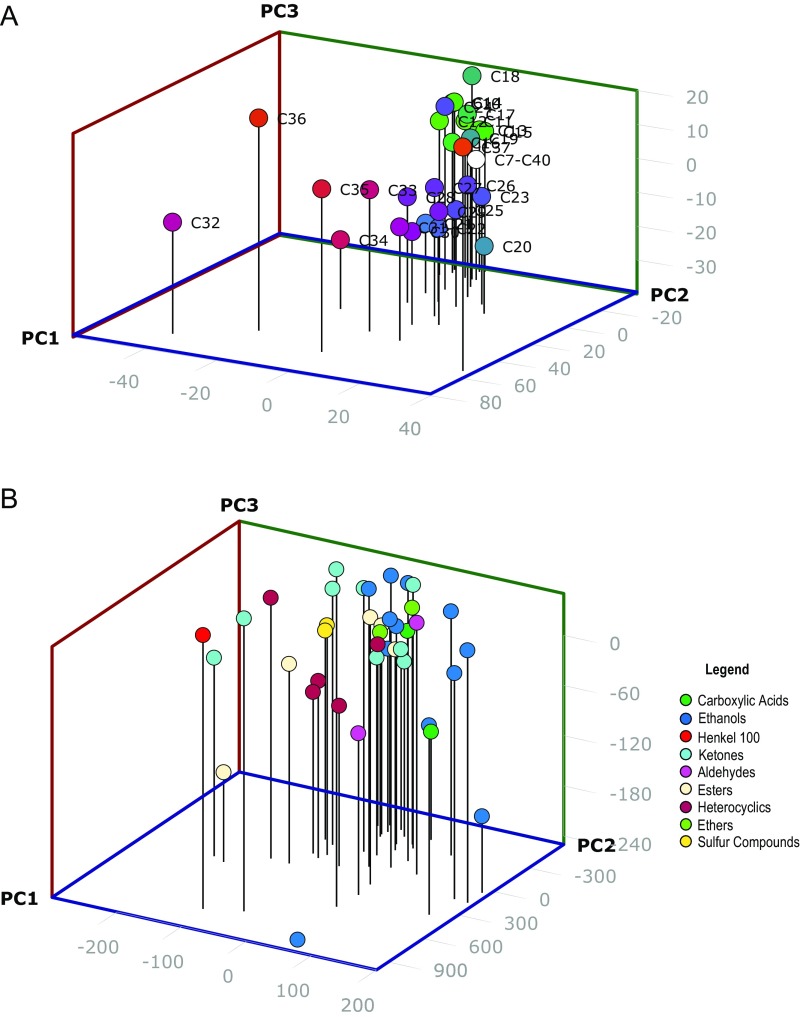
Fig. S3.
PCA of variance in ligand responses. The first three principal components are shown for the CHC response data (A) and the general odorant response data (B). The CHC responses show a particularly clear pattern of segregation along the principal component 1 (PC1) and principal component 2 (PC2) axes, with the longer-chain CHCs generally positioned toward the front-left part of the graph and the shorter-chain CHCs positioned more toward the rear-right section of the graph. For consistency, analyses in both A and B were performed on data before background subtraction of the Orco-Gal4 response.

