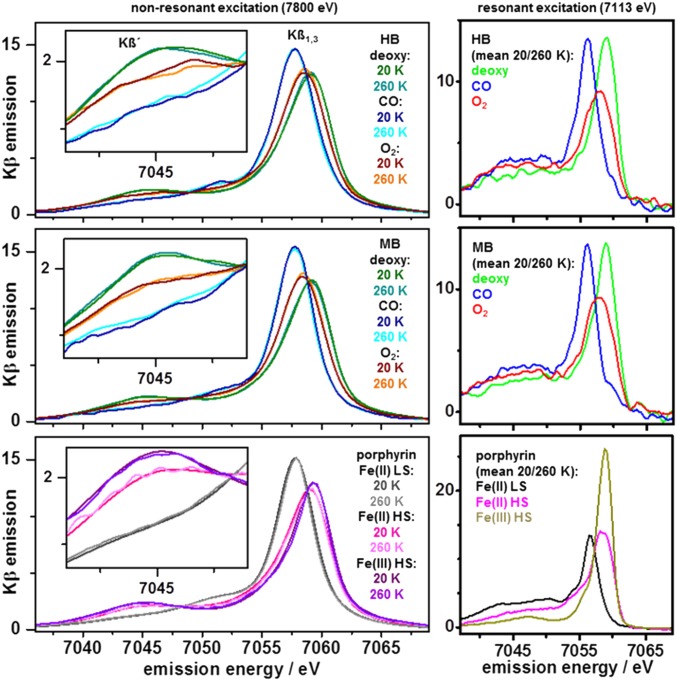
Fig. 2.
Kβ emission spectra of MB, HB, and porphyrin references. (Left) Nonresonantly excited, normalized Kβ main-line spectra at 20 K or 260 K and magnified Kβ´ feature in Inset (Top, MB solution; Middle, HB solution; Bottom, porphyrin compounds 1–3). (Right) Resonantly excited, normalized Kβ main-line spectra (mean of data at 20 K and 260 K).

