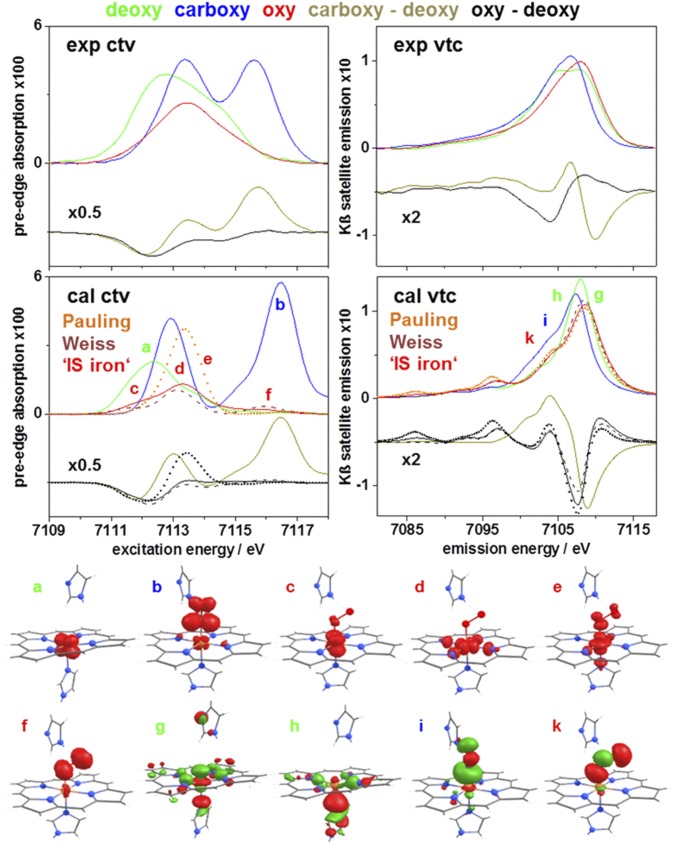
Fig. 5.
Electronic excitation and decay transitions. (Top) Experimental ctv/vtc spectra (background-corrected mean MB/HB spectra/differences at 20/260K, individual spectra in SI Appendix, Fig. S13). (Middle) ctv/vtc spectra from (TD)DFT (vtc area-normalized; mean spectra of relaxed MB/HB heme structures correspond to deoxy, HS Fe(II); carboxy, LS Fe(II); and oxy, LS Fe(II) (Pauling), LS Fe(III) (Weiss), or to a mean of 2 Fe(d) spins (‘IS iron’; SI Appendix, Figs. S17 and S18). (Bottom) Representative target/source MOs for transitions in spectral regions a–k.

