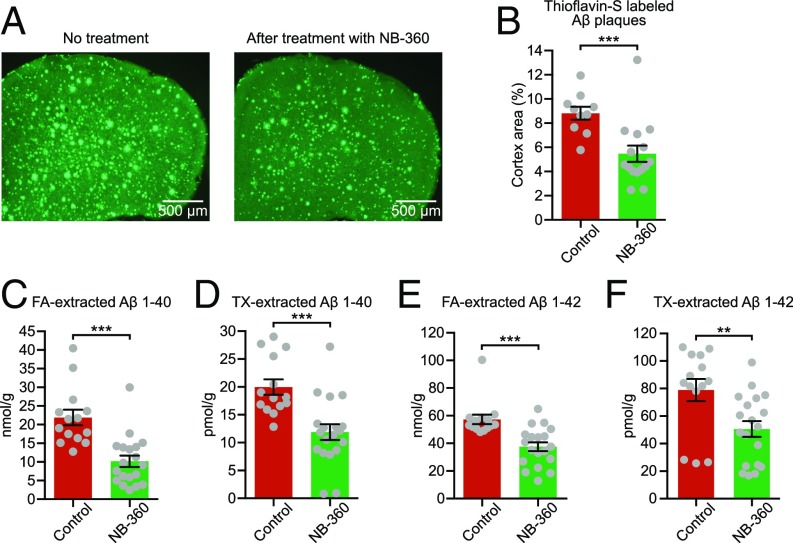
Fig. 1.
BACE inhibition effectively reduces Aβ in APP23xPS45 mice with advanced cerebral Aβ pathology. (A) Representative coronal thioflavin-S–stained sections through the frontal cortex of untreated (control) and NB-360–treated APP23xPS45 mice. (B) Quantitative analysis of Aβ plaque burden in the frontal cortex of untreated (red bar; n = 10) and treated (green bar; n = 15) APP23xPS45 mice. The difference between both groups is highly significant (control: 8.83 ± 0.54% vs. NB-360: 5.47 ± 0.68%; two-sample t test, t = 3.84; df = 22.99; P = 0.0008). (C and D) Summary graph showing the amount of insoluble [formic acid (FA)-extracted (C)] and soluble [Triton-X-100 (TX)-extracted (D)] Aβ 1–40 in forebrains of untreated (red bar; n = 14) and treated (green bar; n = 19) APP23xPS45 mice (insoluble: 21.89 ± 2.10 nmol/g for control vs. 10.18 ± 1.53 nmol/g for NB-360; two-sample t test, t = 4.52; df = 25.30; P = 0.0001; soluble: 19.98 ± 1.39 pmol/g for control vs. 11.89 ± 1.40 pmol/g for NB-360; two-sample t test, t = 4.09; df = 30.27; P = 0.0003). (E and F) Insoluble and soluble Aβ 1–42 in untreated (red bar; n = 14) and treated (green bar; n = 19) APP23xPS45 mice (insoluble: 57.31 ± 3.47 nmol/g for control vs. 37.63 ± 3.21 nmol/g for NB-360; two-sample t test, t = 4.17; df = 29.27; P = 0.0003; soluble: 78.90 ± 8.06 pmol/g for control vs. 50.64 ± 5.70 pmol/g for NB-360; two-sample t test, t = 2.86; df = 24.79; P = 0.0084). Note that Aβ was determined after the physiological measurements, during which animals had no access to food and BACE inhibitor. **P < 0.01, ***P < 0.001. Error bars represent mean ± SEM.

