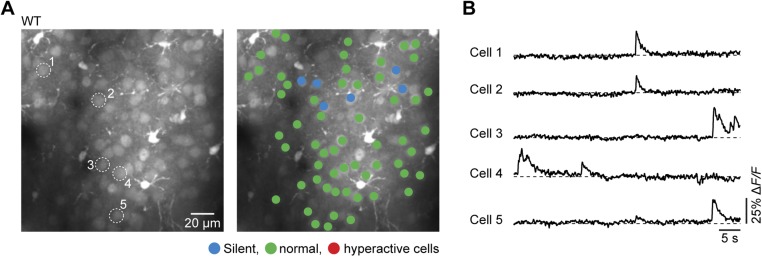
Fig. S1.
Normal activity of cortical neurons in WT mice in vivo. (A, Left) Representative in vivo two-photon fluorescence image of layer 2/3 cell population in the frontal cortex and corresponding activity map obtained from a WT mouse (A, Right). In the activity map, neurons are color-coded according to their activity status. (B) Activity traces from five example neurons marked in A, Left.

