Fig. 4.
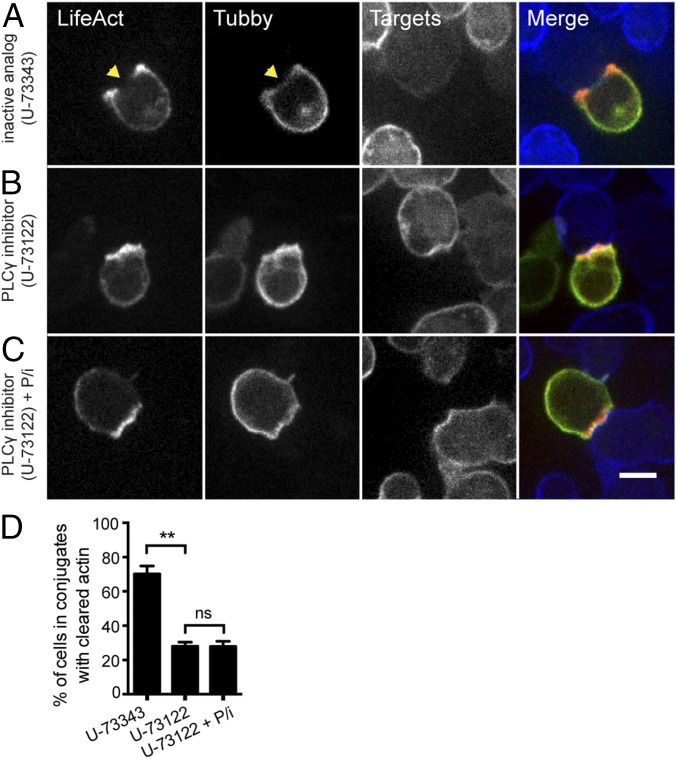
Pharmacological inhibition of PLCγ inhibits actin clearance in CTLs. (A–C) Representative spinning-disk images of OT-I CTLs expressing Lifeact-mApple (red) and Tubby-EGFP (green) interacting with 1 μM OVA257–26 peptide-pulsed EL4-Farnesyl-TagBFP2 target cells (blue) in the presence of 1 μM U-73343 inactive analog control (total n = 175) (A), 1 μM U-73122 PLCγ inhibitor (total n = 184) (B), or 1 μM U-73122 plus PMA and ionomycin (P/i) at 20 ng/mL and 1 μg/mL, respectively (total n = 140) (C). Lifeact-mApple and Tubby-EGFP channels are shown in gray scale. (Scale bar: 5 μm.) Regions of fluorescence depletion are indicated by yellow arrowheads. (D) The graph depicts the percentage of cells in conjugates with recovered actin (mean ± SD) from more than three independent experiments. **P < 0.01, Student’s t test; ns, not significant.

