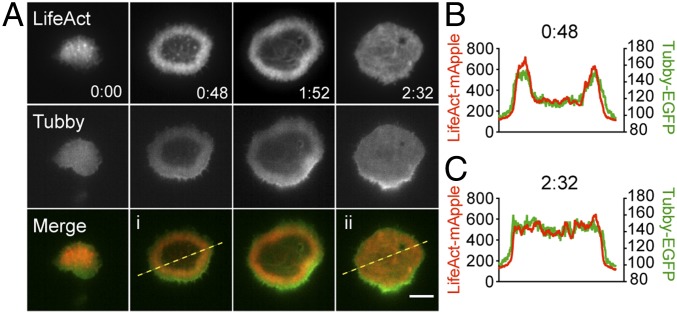
Fig. 6.
PIP2 correlates with cortical actin clearance and recovery at the synapse. (A) Representative TIRF images of an OT-I CTL expressing Lifeact-mApple (red) and Tubby-EGFP (green) interacting with an anti-CD3–coated glass. Lifeact (Top Row) and Tubby-EGFP (Middle Row) are shown in gray scale. Merged images (Bottom Row). (B and C) Dashed yellow lines in Ai and Aii indicate the area from which line scans at 0:48 (B) and at 2:32 (C) are derived, showing Lifeact (red) and Tubby-EGFP (green) intensities across the region of interest. n = 11 cells from four independent experiments. (Scale bar: 5 μm.) Time is shown in minutes:seconds.

