Fig. 7.
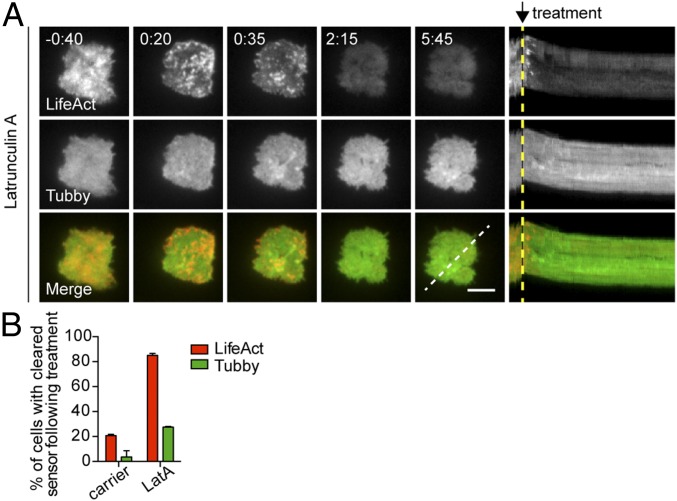
Removal of recovered cortical actin does not affect PIP2 at the synapse. (A, Left) Time-lapse TIRF images of an OT-I CTL expressing Lifeact-mApple (gray scale, Top Row) and Tubby-EGFP (gray scale, Middle Row) or merged channels (Bottom Row) that already had secreted and recovered actin in response to anti-CD3–coated glass surfaces (−0:40) and then were treated at 0:00 with 1 μM LatA. (Right) Kymographs of movies. Fluorescence under a three-pixel-thick region of interest (dashed white line) is displayed over time. Dashed yellow lines indicate the time of treatment addition. (Scale bar: 5 μm.) Time is shown in minutes:seconds. (B) The graph depicts the percentage of cells that cleared reporter (Lifeact, red bars or PIP2, green bars) at the membrane after treatment with carrier or LatA. Data are shown as mean ± SD from three independent experiments; n = 19 for carrier-treated cells; n = 81 LatA-treated cells.

