Fig. 8.
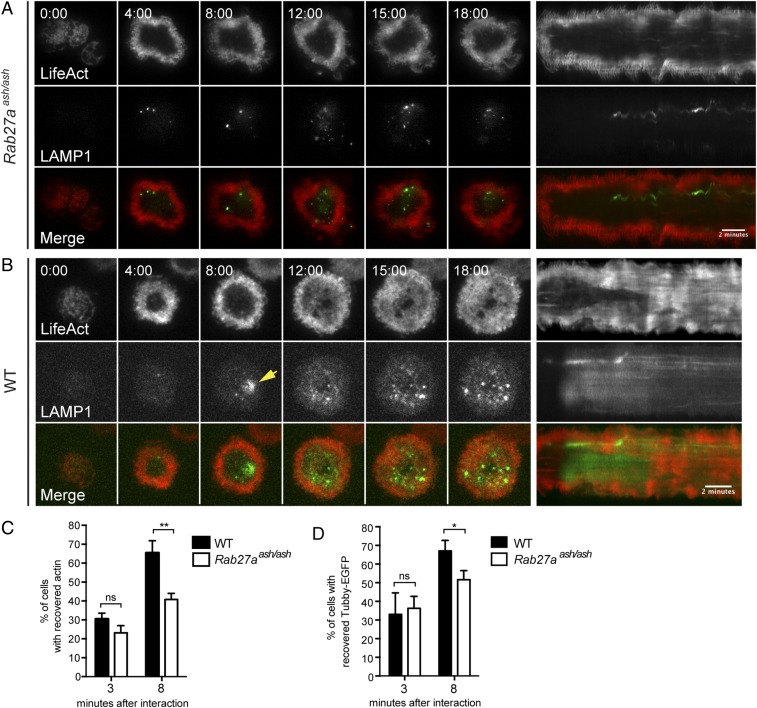
Secretion-deficient Rab27aash/ash CTLs show impaired actin recovery. (A and B) Representative time-lapse TIRF images (Left) and kymographs of movies (Right) of Rab27aash/ash (A) or WT (B) CTLs expressing Lifeact-mApple (red) and LAMP1-EGFP (green) interacting with anti-CD3–coated glass. Gray scale images for Lifeact (Top Rows) and LAMP1 (Middle Rows) are included; Bottom Rows show merged channels. A yellow arrowhead in B highlights the degranulation event in the WT panel. (Scale bar: 2 min in kymographs.) Time is shown in minutes:seconds. n = 6 WT CTLS and n = 9 Rab27aash/ash CTLS from three independent experiments. (C) The graph represents the percentage of WT (black bars) or Rab27aash/ash (white bars) cells with recovered actin at 3 min and 8 min after interaction with an anti-CD3–coated glass. Data are shown as mean ± SD. For the 3-min time point, n = 1,791 WT cells and n = 1,418 Rab27aash/ash cells. For the 8-min time point, n = 3,123 WT and n = 3,054 Rab27aash/ash cells, both from three independent experiments. **P < 0.01; Student’s t test; ns, not significant. (D) The graph represents the percentage of WT (black bars) or Rab27aash/ash (white bars) cells with recovered PIP2 at 3 min and 8 min after interaction with an anti-CD3–coated glass (mean ± SD). For the 3-min time point, n = 282 WT and n = 299 Rab27aash/ash cells. For the 8-min time point, n = 288 WT and n = 248 Rab27aash/ash cells. Actin and PIP2 were quantitated from two different sets of three independent experiments. *P < 0.05, Student’s t test; ns, not significant.

