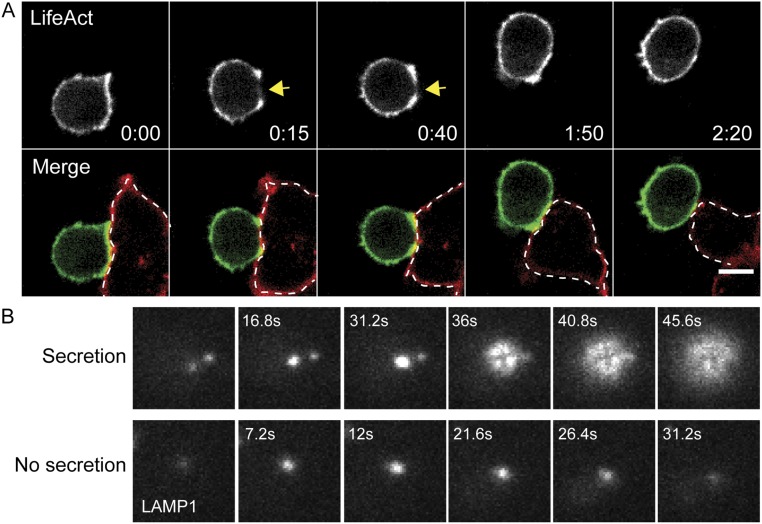
Fig. S1.
Cortical actin at the synapse during CTL–target interactions and examples of granule fusion in TIRF. (A) Spinning-disk confocal time-lapse images of an OT-I CTL expressing Lifeact-mEmerald (Top, grayscale) interacting with an EL4 target cell expressing TagRFP-MEM pulsed with 1 μM OVA257–26 (merged images, CTL in green, target in red highlighted by dotted line). (Upper Row) Images in gray scale showing signal from the Lifeact (488) channel in a single slice correspond to the center of the synapse. Yellow arrowheads highlight an area of reduced cortical actin density. Images are representative of n = 11 cells from three independent experiments. (B) Time-lapse TIRF images of a CTL expressing LAMP1-EGFP comparing the fluorescence signal of a secreting lytic granule (Upper Row) with a lytic granule in a cell moving into the TIRF field but with no secretion (Lower Row).

