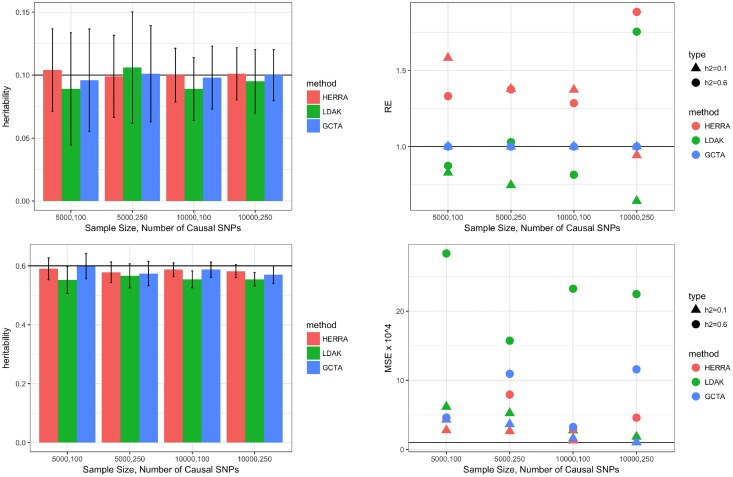
Fig 2.
Simulation results of dichotomous trait and one chromosome: left-top figure is of h2 = 0.1, left-bottom figure is of h2 = 0.6; in the left figures colored bar represents the mean of estimated heritability, and vertical black bars are mean ± two standard errors; right figures present the relative efficiency (RE), and mean-squared error (MSE) × 104. For HERRA and LDAK, RE is defined as the ratio of the variance of GCTA’s estimator to the respective variance of HERRA and LDAK estimators.

