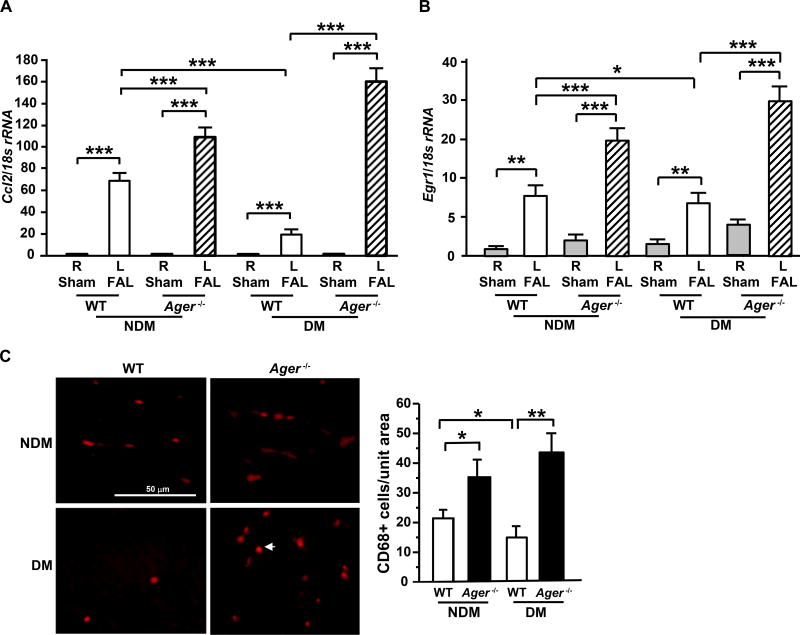
Figure 2. Gene expression and macrophage infiltration in hind limb ischemia: effect of RAGE.
(A–B) Total RNA was isolated from the indicated skeletal muscle and subjected to real-time PCR analysis. Ccl2 mRNA was detected on day 7 after FAL vs. sham (A) and Egr1 mRNA was detected on day 5 after FAL vs. sham (B), and normalized to 18s rRNA (n=5 mice/group). (C) Immunostaining with anti-CD68 IgG was performed on skeletal muscle tissue from the indicated mice on day 7 after FAL and the mean number of CD68+ cells/unit area is reported (n=3 mice/group). R denotes right leg/sham control and L denotes left leg/femoral artery ligation (FAL). NDM denotes non-diabetes and DM denotes diabetes. Error bars represent ±SEM. *p<0.05, **p<0.01, ***p<0.001.

